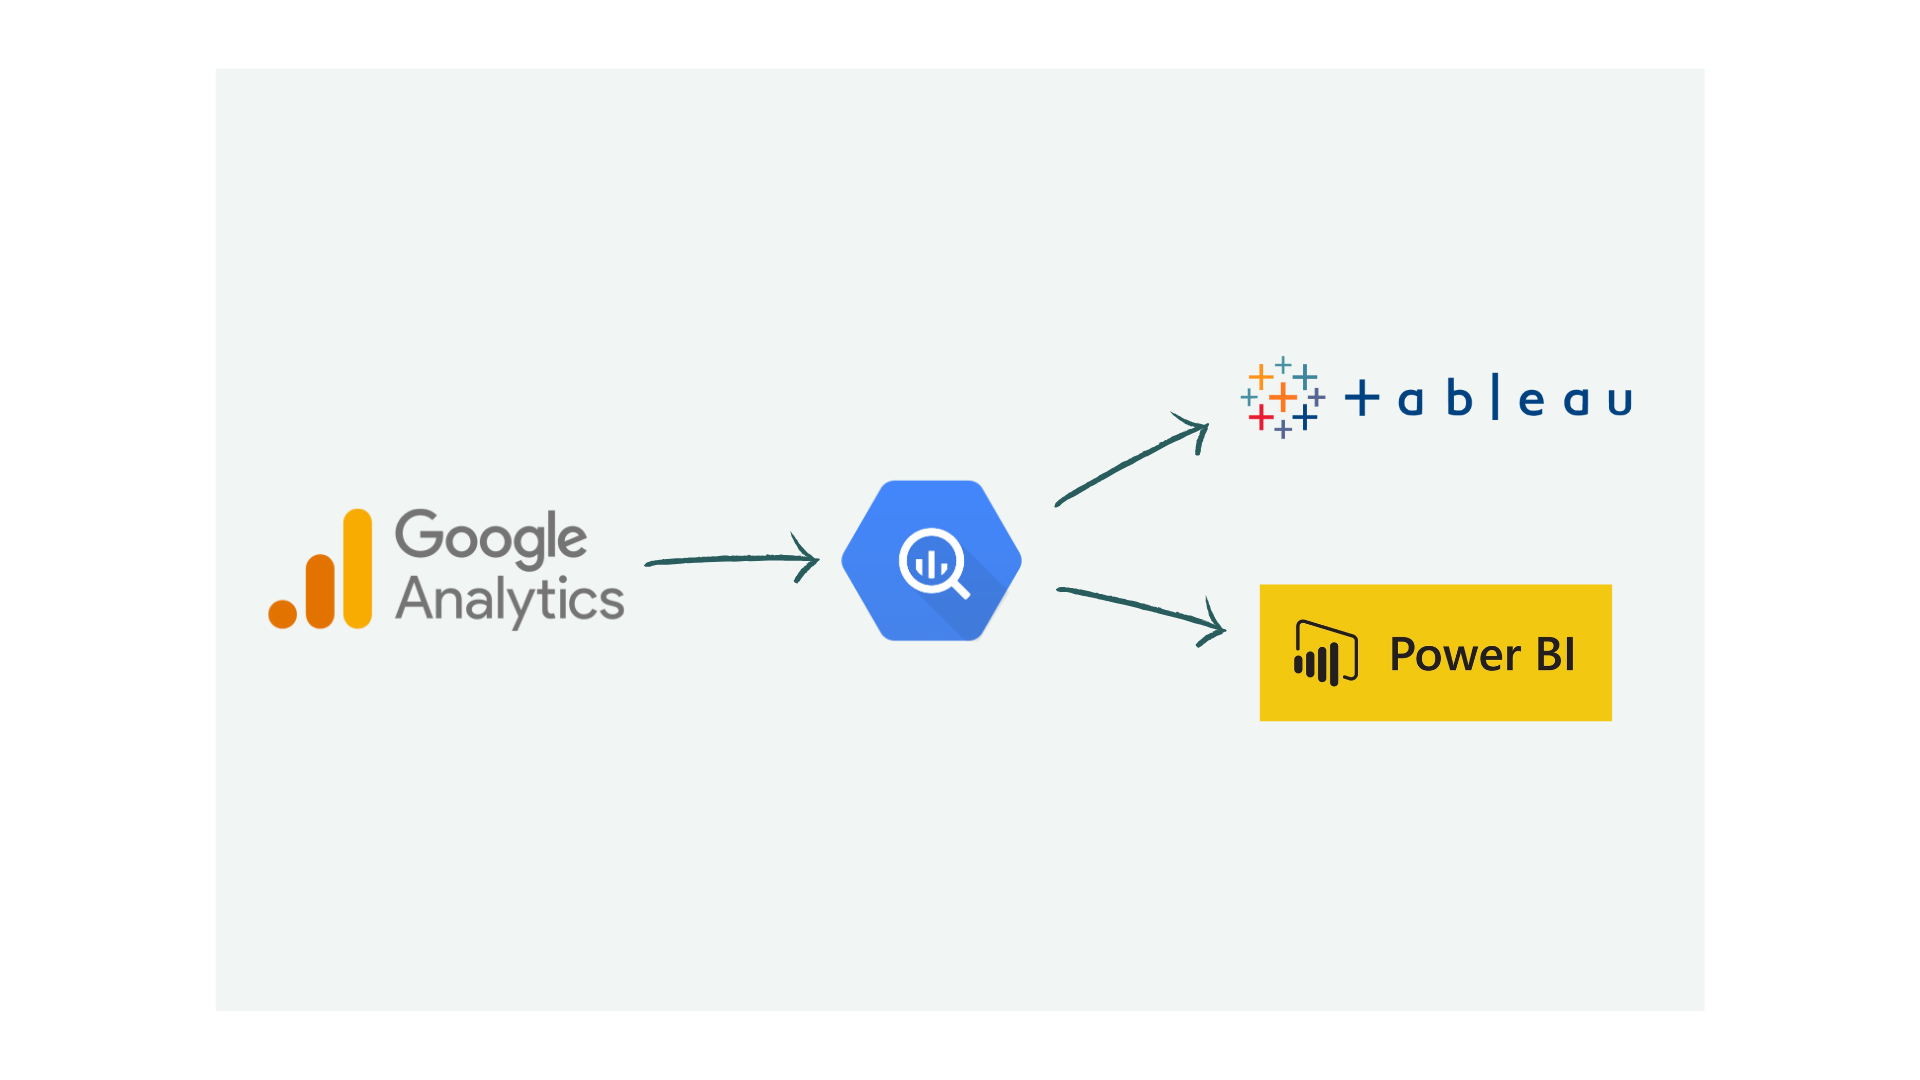
Google Analytics is a foundational tool for tracking website performance, but its built-in reporting capabilities may not meet the sophisticated needs of data-driven businesses. By exporting Google Analytics data to platforms like Tableau, PowerBI, and BigQuery, organizations can employ machine learning algorithms, create dynamic recommendation systems, and perform granular analysis that goes beyond the realm of Looker Studio’s capabilities. For a deeper understanding of why solutions like PowerBI or Tableau offer more robust analytics than Looker Studio, read our comprehensive comparison here.
Enhancing Visualization with Tableau and PowerBI
When Google Analytics data is exported to Tableau or PowerBI, the visual representation posibilities are very diverse and customizable. These powerful BI tools allow for the creation of interactive dashboards and reports that can be customized to suit any analytical need. They enable businesses to visualize complex datasets and uncover trends that might otherwise remain hidden within the confines of Google Analytics.
Leveraging BigQuery for Deep Dives into Data
Exporting data to BigQuery opens the door to handling massive datasets with ease. It provides the scalability and speed necessary for running complex SQL queries on Google Analytics data. This empowers analysts to dissect user behavior, conversion paths, and more, with a level of detail that can inform strategic business decisions.
Machine Learning for Predictive Insights
With the data exported from Google Analytics, machine learning models can be trained to predict future user behavior, identify potential churn, and optimize marketing campaigns. These predictive models can be integrated into Tableau or PowerBI, allowing for real-time predictive insights directly within your business intelligence dashboards.
Building a Recommendation System with Google Analytics Data Export
Recommendation systems have become essential for e-commerce and can be built using the rich data exported from Google Analytics. By analyzing session data with machine learning techniques, businesses can predict which products a user is likely to purchase together or view next, enhancing cross-selling and up-selling strategies.
The Limitations of Looker Studio
While Looker Studio (formerly known as Google Data Studio) provides a user-friendly interface for analyzing Google Analytics data, it falls short when it comes to the advanced analytical capabilities offered by Tableau and PowerBI. These platforms support more complex data modeling and provide a wider range of visualization options, making them better suited for businesses that require detailed and customized data analysis.
Real Life Business Scenarios and Examples
Integrating External Data for Holistic Analytics
Perhaps the most significant leap beyond Google Analytics is integrating external data for a holistic view of business performance. Combining website data with information from CRM and ERP systems can yield a 360-degree view of customer interactions, from first contact to sale to post-sale service.
Combining Google Analytics data with CRM systems can unveil the complete customer lifecycle, from anonymous visitor to loyal customer. It can answer questions like:
- How do marketing efforts correlate with sales pipeline growth?
- What are the common characteristics of top-spending customers?
- Which customer service touchpoints lead to repeat purchases?
Similarly, integrating ERP data allows for a unified view of online behavior and operational logistics. This synergy enables businesses to:
- Align inventory levels with traffic and conversion trends.
- Tailor online marketing campaigns based on product availability and lead times.
- Optimize the entire supply chain from user acquisition to product delivery.
Holistic analytics provide actionable insights that drive strategic business decisions. By understanding the full picture, companies can:
- Optimize cross-departmental strategies.
- Improve customer satisfaction through personalized experiences.
- Achieve a competitive advantage by rapidly responding to market changes.
Overcoming GA4 Data Retention Limits
The latest GA4 data retention policy states that for all Google Analytics 4 properties, the default retention time for data, including conversions, is 14 months. Additionally, for other types of data related to events, users have the option to set the event data retention length to either 2 months or 14 months. This limitation can be a significant challenge for businesses seeking to analyze long-term trends and make strategic decisions based on historical data.
By exporting and storing Google Analytics data in a BigQuery data warehouse, companies can effectively overcome these retention restrictions.
A data warehouse not only allows for the retention of data beyond the 14-month limit but also provides enhanced capabilities for deep analysis. This approach ensures that businesses can maintain a comprehensive view of their historical data, facilitating more accurate and informed decision-making.
Storing data in BigQuery enables long-term trend analysis, year-over-year comparisons, and the development of richer customer behavior insights, all of which are crucial for strategic planning and maintaining a competitive edge in the market.
Custom Visitor Segmentation and Behavioral Modeling
Traditional segmentation in Google Analytics may suffice for basic marketing needs, but advanced data warehousing allows businesses to delve into behavioral modeling. Here, data scientists can construct complex algorithms to predict future user actions. For instance, by analyzing sequences of events over time, companies can identify which users are likely to convert or churn and tailor strategies accordingly.
Understanding the Customer Journey in Detail
The path a customer takes before making a purchase is often complex and not just a single step. Relying solely on the attribution models GA4 provides doesn't always provide the full picture. Using a data warehouse, businesses can apply more detailed methods that recognize every interaction a customer has with the brand. This approach gives a clearer and more complete view of what really influences customers to make a purchase.
Real-time Personalization and Dynamic Pricing
Real-time personalization and dynamic pricing are out of reach for Google Analytics alone. However, streaming this data into a data warehouse can empower businesses to adjust their offerings on the fly based on user interactions, optimizing the user experience and maximizing revenue potential.
Complex Funnel Analysis and Drop-off Optimization
Google Analytics provides a snapshot of user funnels, but it often simplifies the complexity of user interactions. Advanced data warehousing allows for the creation of intricate funnels, illuminating precise drop-off points. Subsequent analysis can reveal the underlying reasons for these drop-offs, enabling businesses to implement targeted improvements.
Conclusion
The export of Google Analytics data is a gateway to advanced analytics that can transform how businesses interact with their customers and make strategic decisions. By taking advantage of the strengths of BigQuery, Tableau, PowerBI, and machine learning, companies can move beyond the limitations of Looker Studio to unlock actionable insights and drive significant business outcomes.