In today's business environment, efficiency and accuracy are paramount. Many professionals, like you, might find themselves asking, "How can I automate Excel and Google Sheets reports?" It's a question born out of the need for streamlined processes and the desire to make the most out of the data at hand.
The Limitations of Excel and Google Sheets
First, let's acknowledge the elephant in the room: Excel and Google Sheets are fantastic tools. They are accessible, flexible, and familiar to most. However, when it comes to handling large datasets, complex calculations, and dynamic reporting needs, these tools start to show their limitations. They are prone to human error, become cumbersome with large data sets, and lack real-time data processing capabilities.
The Power of Data Analytics
This is where data analytics comes in. Think of data analytics as the enhanced, more capable sibling of your standard spreadsheet software. It's not just about processing numbers; it's about gaining insights, making informed decisions, and driving your business forward.
Laying Down a Data Analytics Foundation
The journey begins by establishing a data analytics foundation. This involves moving beyond the confines of Excel and Google Sheets and embracing robust tools like PowerBI, Tableau, or Domo. These platforms are designed to handle vast amounts of data, integrate various data sources, and provide real-time analytics and interactive dashboards.
Connecting Through APIs
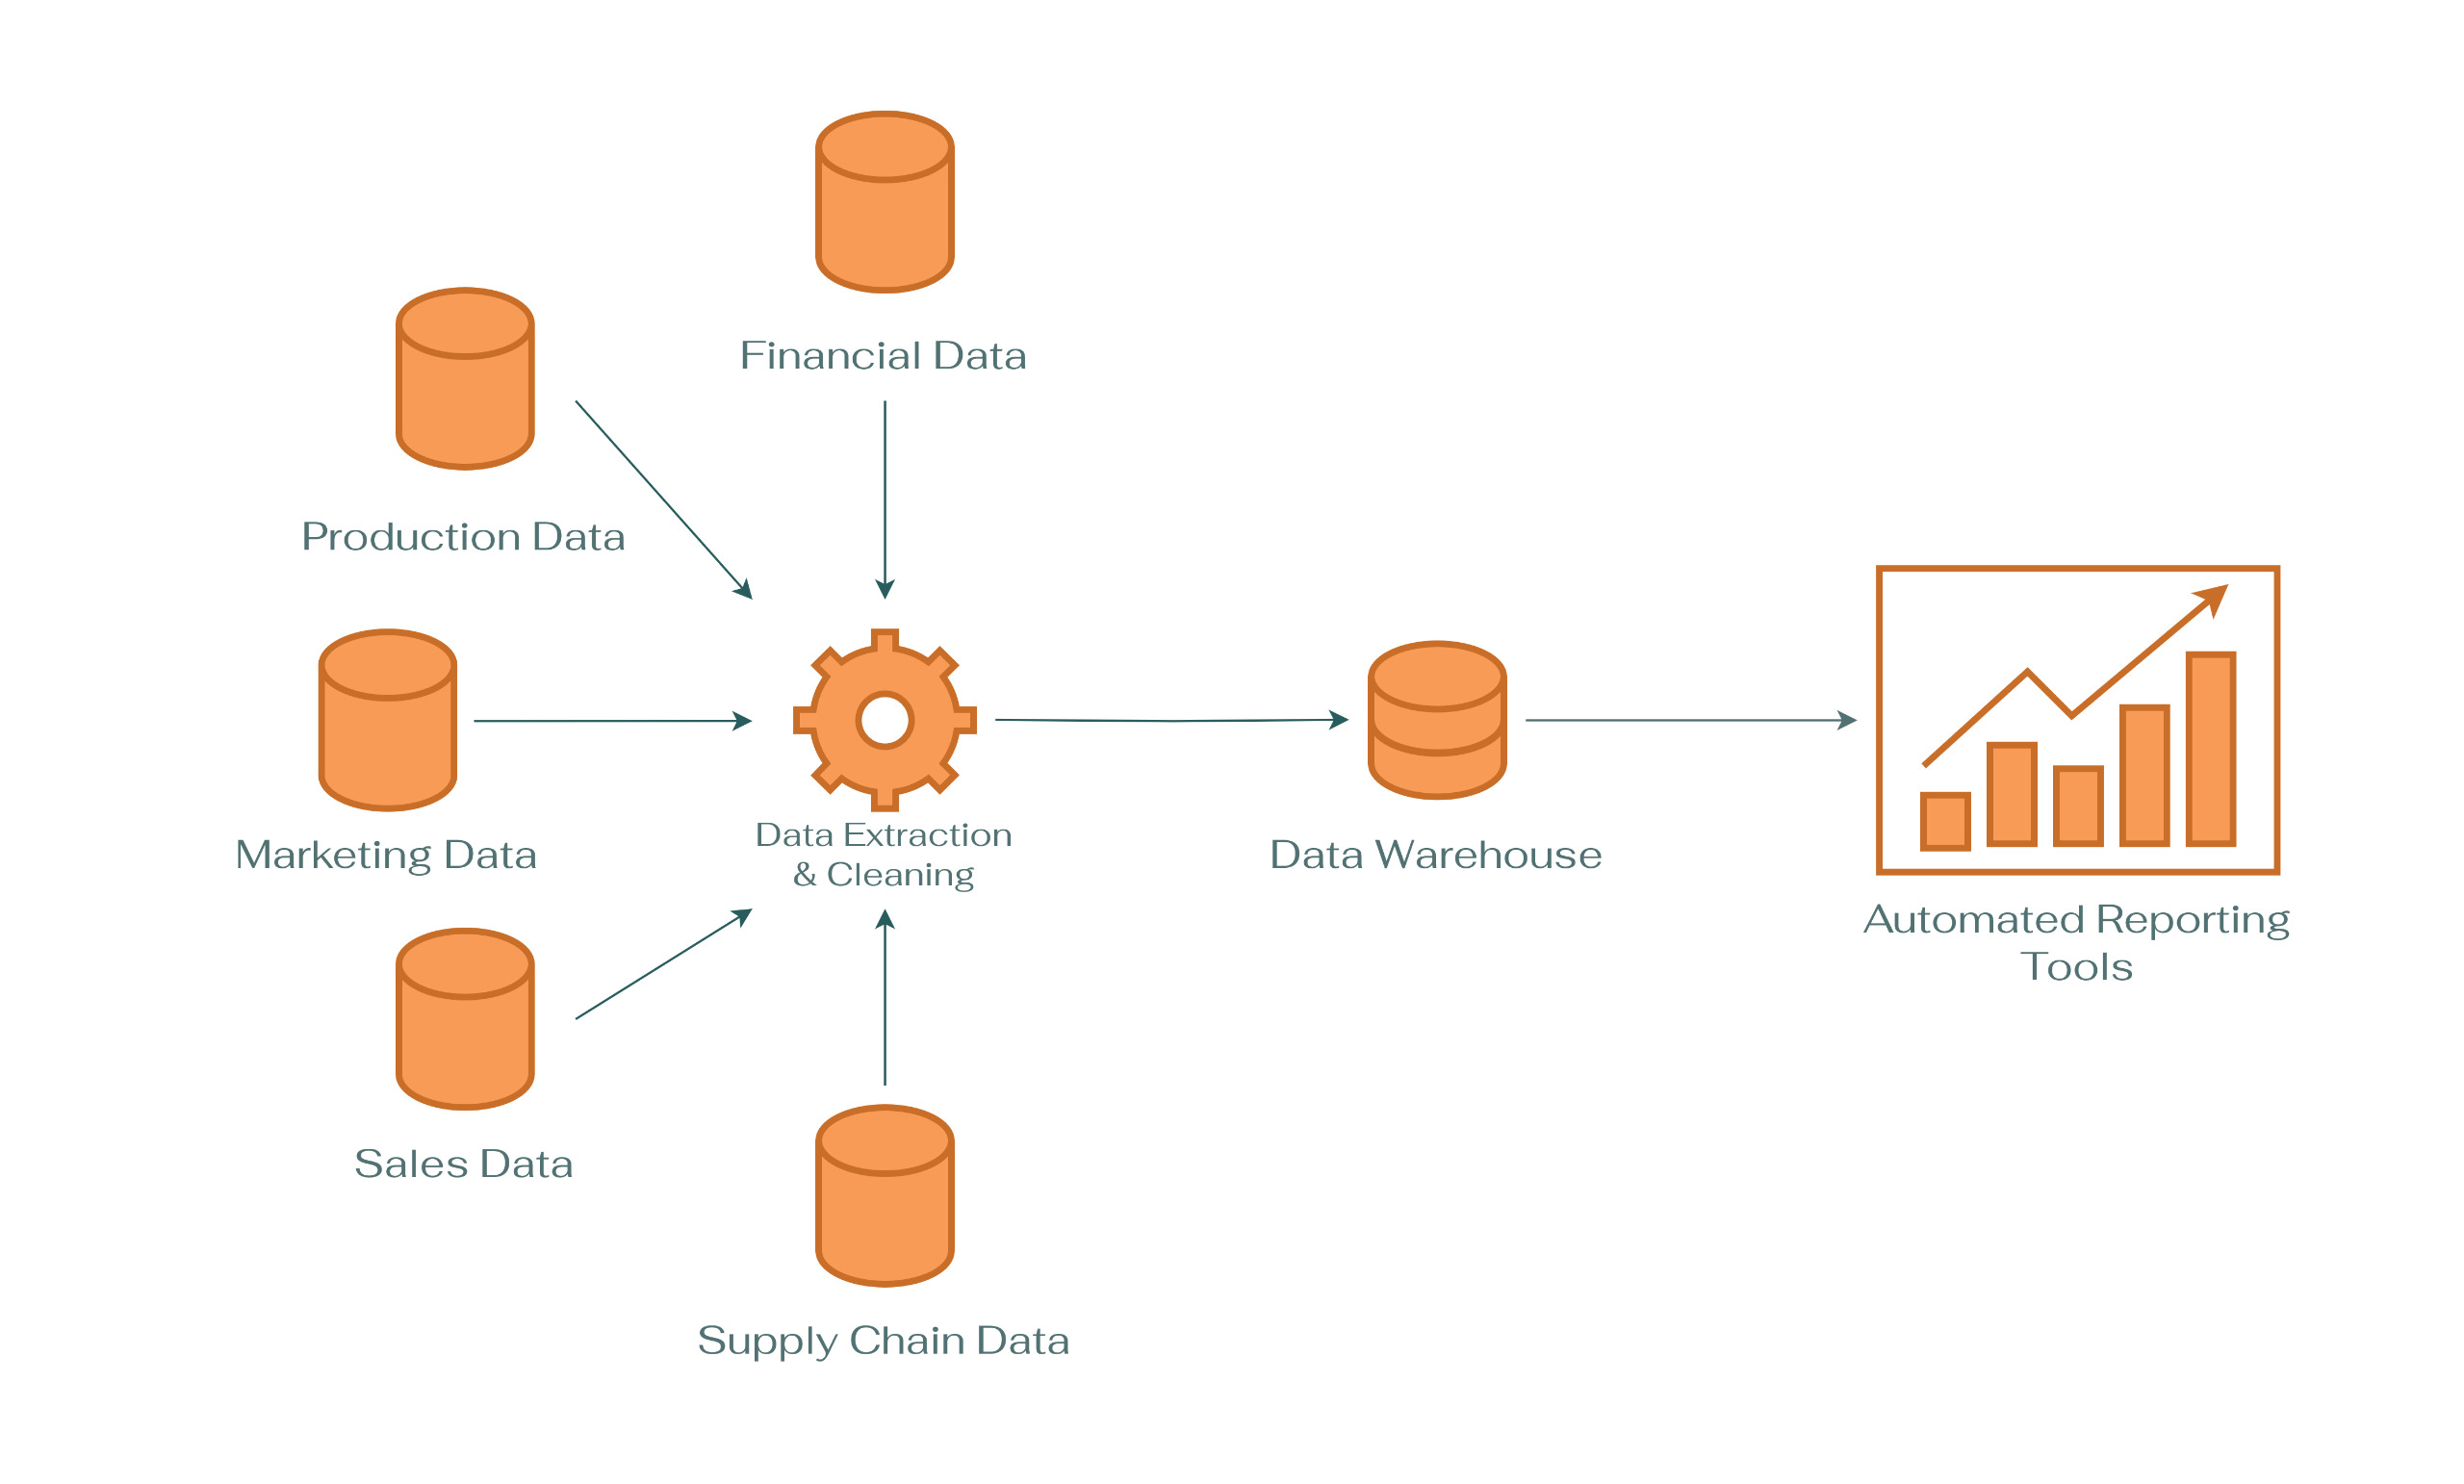
To automate your reporting, the first step is to connect your data sources through APIs (Application Programming Interfaces). APIs allow different software applications to communicate with each other. By connecting your business systems (like CRM, ERP, accounting software, or marketing platforms) through APIs, you can automatically pull data into your analytics platform.
Extracting and Cleaning Data
Data analytics tools excel in extracting and cleaning data. This process, called data engineering, involves removing inaccuracies, duplications, and irrelevant information. Clean data is crucial for accurate analysis and reporting. Read this article to see some examples of data engineering tools that do a great job in handling massive amounts of data.
Aggregating Data
Once the data is clean, it is aggregated to provide a comprehensive view. Aggregation can involve compiling data from different sources, time periods, or departments to create a holistic picture of your business's performance.
Utilizing Robust Tools for Analysis and Reporting
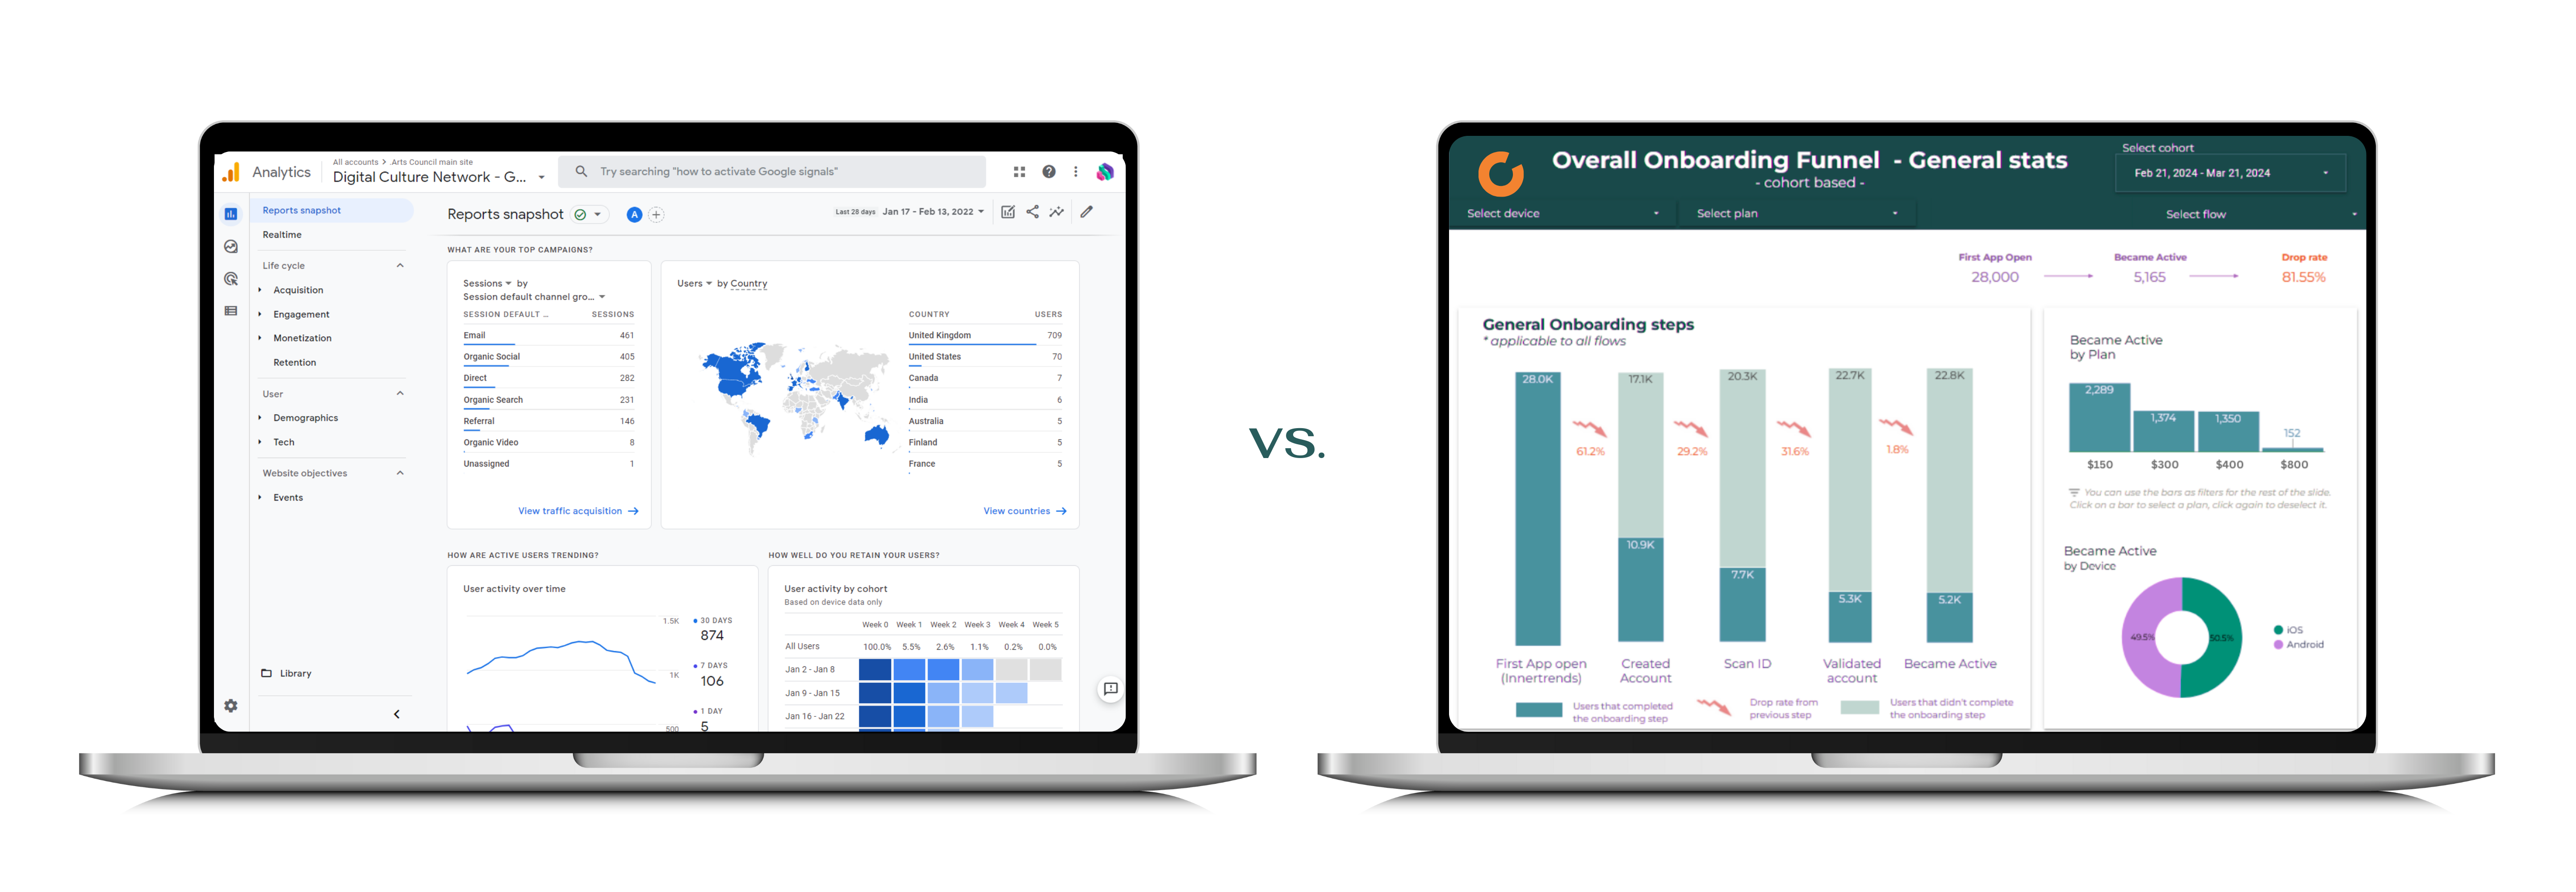
Tools like PowerBI, Tableau, or Domo offer advanced capabilities that Excel and Google Sheets can't match. They allow for complex calculations, data modeling, and creating interactive dashboards. These dashboards can be customized to show key metrics relevant to your business, providing insights at a glance.
Why Move Beyond Excel for Automation?
Real-Time Data and Insights
Data analytics tools offer real-time data processing. This means you can see the impact of your decisions immediately, rather than waiting for manual updates.
Scalability
As your business grows, so does your data. Data analytics tools are designed to scale with your business, handling more data and more complex analyses without compromising performance.
Advanced Analytics
Beyond simple calculations, these tools provide predictive analytics, trend analysis, and data modeling. This allows for more nuanced and forward-thinking business strategies.
Reduced Error and Increased Efficiency
Automating your reports reduces the risk of human error, a common issue with manual data entry in Excel and Google Sheets. It also frees up valuable time for your team to focus on strategic tasks rather than repetitive data entry.
Embracing the Change
Adopting data analytics for your reporting needs is not just about keeping up with technology; it's about staying ahead in the competitive business landscape. It's an investment in your company's future, one that pays off in the form of more informed decision-making, improved efficiency, and a deeper understanding of your business.
Conclusion
To answer the question, "how to automate Excel and Google Sheets reports", the solution lies not in the tools themselves, but in transitioning to a more robust, scalable, and insightful data analytics approach. It's about harnessing the power of your data to drive your business forward. And remember, this isn't just about numbers and charts; it's about the story your data tells about your business, and how you can use that story to create a more successful, efficient, and dynamic future.