Challenge: The owner of a growing coffee shop chain knew something was wrong. Foot traffic was up, online orders were climbing, and she had more customer data than ever. But none of it was connected. Campaigns went out to everyone or no one, and the customers who mattered most were slipping away without anyone noticing.
She had tried everything she could think of: a 5+1 free loyalty card, subscription plans for nearby office workers, one-time discount codes. She had also spent money on media buying agencies to run digital ad campaigns. The results were disappointing, and the incentive structure explained why: agencies earned a percentage of ad spend, so their commission grew when the budget grew, regardless of whether the campaigns actually brought customers back. More spend meant more fees, not better targeting.
After burning through budget on broad campaigns with no measurable return, she was left with the same problem. Some promotions worked, some didn't, and she had no way to tell which customers responded to what. Every decision was still a guess.
The numbers told a frustrating story:
- 15% of walk-in and 45% of online customers were identifiable through accounts, but their purchase history was sitting unused in separate systems.
- Campaign targeting was manual and based on intuition. A first-time visitor got the same promotion as a daily regular who had quietly stopped coming.
- There was no system to detect when a valuable customer was drifting away, and no trigger to bring them back before it was too late.
The most important unanswered question: are there customer segments that are not properly served?
Solution
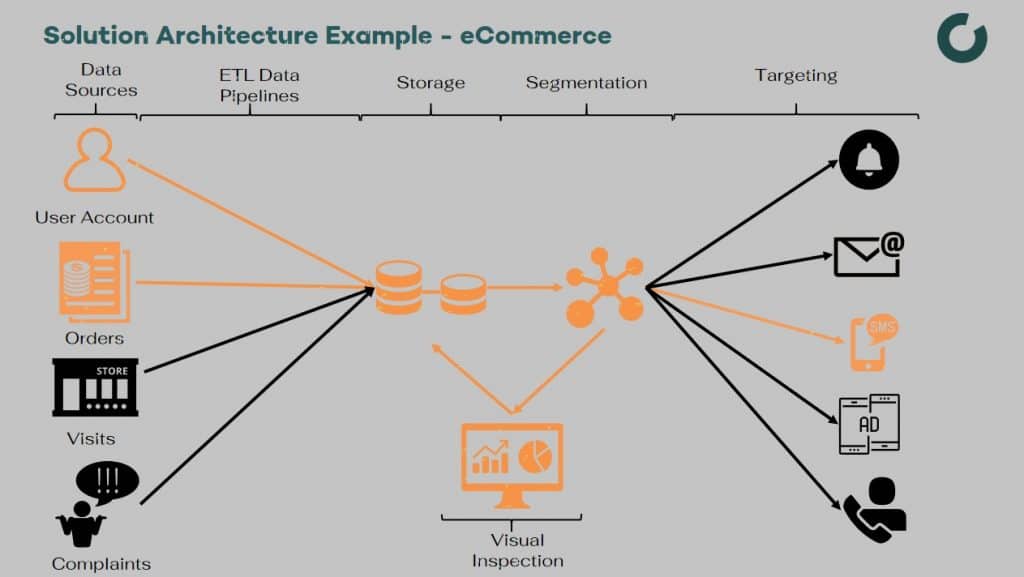
We designed and implemented a three-phase solution: build the data infrastructure, segment the customer base, and automate targeted campaigns for each segment.
Step 1: Connect, Extract, Clean, and Store the Data
Before we could answer any questions about customer behavior, we needed one place where all the data lived together. The business had two systems that had never talked to each other:
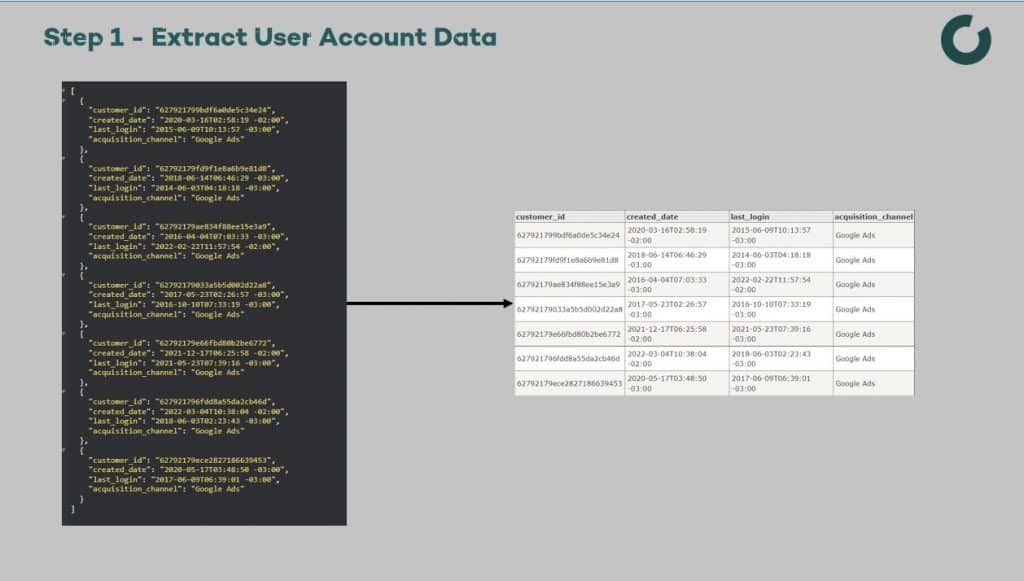
- Account management system
- customer profiles with names, contact details, registration dates, and preferences.
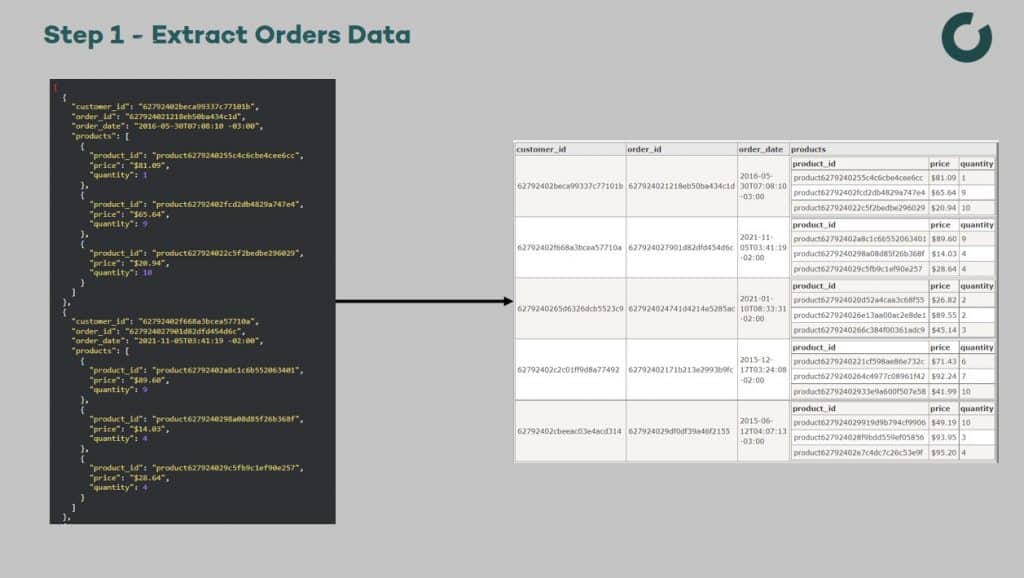
- POS orders API
- full transaction history including order dates, items, amounts, and frequency.
A customer might have 200 orders in the POS system and a complete profile in the account system, but nothing connecting the two. We set up a Linux server with a MySQL database and built ETL pipelines to extract data from both sources, clean it, and merge it into a single customer record.
The POS provider had launched an Orders API in 2019, so connecting to it and pulling the full transaction history was straightforward:
Step 2: Build and Implement Customer Segmentation
With all customer data in one place, the next question was how to segment it. The owner's initial instinct was to group customers by what they ordered - coffee vs. food, morning vs. afternoon. We explored that direction but quickly saw the limitation: product preferences alone don't tell you who is about to leave and who is ready to spend more. A customer who only orders espresso could be a daily regular worth hundreds per month or a one-time visitor who never comes back.
We chose RFM (Recency, Frequency, Monetary) analysis instead, because it answers the questions that actually drive campaign decisions. RFM scores each customer on three dimensions:
- Recency: When did they last order? Current means within the last 90 days. Lapsed means 91 to 270 days. Dormant means over 270 days of no activity.
- Frequency: How often do they order? Occasional is 1 to 3 orders. Regular is 4 to 15. Frequent is 16 or more.
- Monetary: What is their total lifetime spend? Low is under $50, Medium is $50 to $200, and High is over $200.
By combining these three scores, we grouped every identifiable customer into eight segments: VIP Regulars (current, frequent, big spenders), Steady Visitors (current regulars with moderate spend), Promising Newcomers (current but only a few orders), Loyal Lights (frequent but low spend), and on the other end: Drifting Away, Cooling Off, Gone Cold, and Lost.
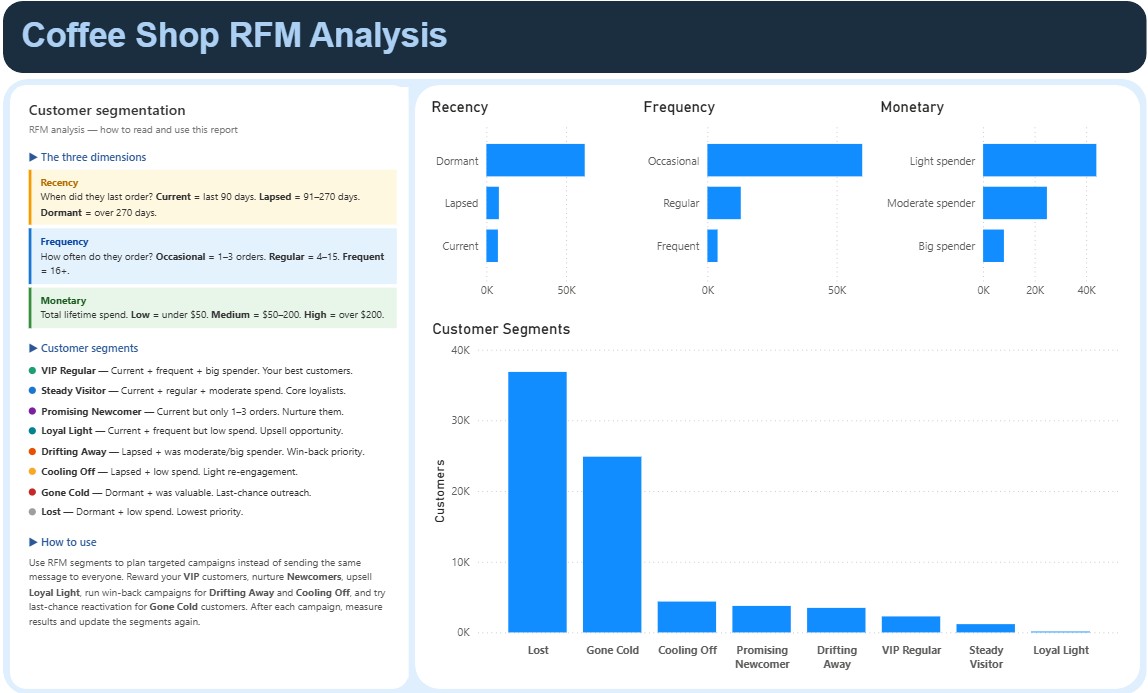
The dashboard made something immediately visible that the owner had suspected but could never prove. The two largest segments were Lost (over 35,000 customers) and Gone Cold (24,863 customers). Gone Cold was the alarming one: these were not low-value visitors who tried the shop once and never returned. They were previously moderate-to-big spenders who had been dormant for over 270 days. The business had lost them quietly, with no outreach attempt.
Meanwhile, the active segments - VIP Regulars, Steady Visitors - were comparatively small. The chain was acquiring customers but failing to retain the valuable ones.
For a deeper dive into how RFM analysis works, see our guide to RFM customer segmentation.
Step 3: Define and Automate a Communication Strategy
Each segment needed a different approach, and the strategy had to be baked into the system so it wouldn't depend on someone remembering to run a campaign. We built a recommended outreach action directly into the segmentation model. Hovering over any segment in the dashboard shows the suggested next step:
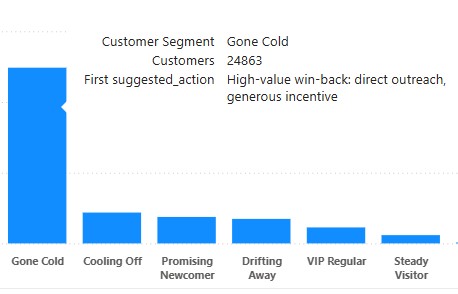
Gone Cold (24,863 customers who were previously moderate-to-big spenders but dormant for over 270 days): The dashboard flagged these for "high-value win-back: direct outreach, generous incentive." With nearly 25,000 people in this segment, personal calls were not realistic. Instead, we built an automated SMS reactivation campaign through the business's Twilio account. The pipeline:
- Monitors customer recency scores daily as new order data flows in.
- Triggers an SMS with a generous discount code when a customer crosses the dormancy threshold.
- Sends the message 10 minutes before the time the customer used to visit.
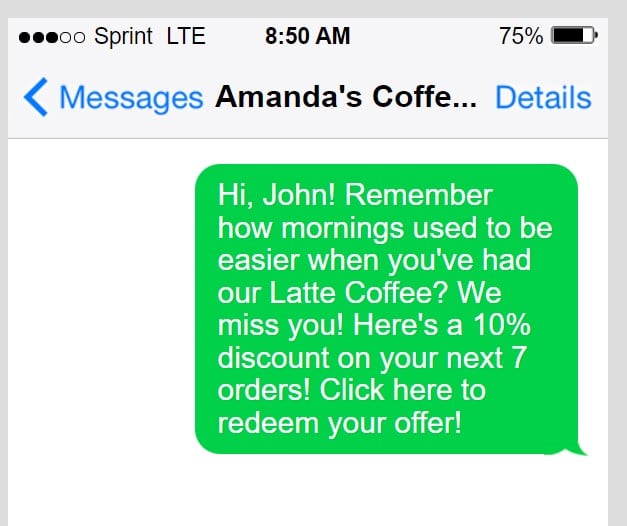
That last detail matters. The system uses each customer's historical order timestamps to calculate their typical visit window, then delivers the SMS right before it. A customer who always ordered at 8:15 AM gets the message at 8:05 AM, when coffee is already on their mind.
To complement the automation, we sampled a subset of Gone Cold customers for personal phone calls. The goal was not to sell but to listen: a salesperson would ask directly why they stopped ordering and log responses in a structured feedback form. This generated qualitative insight that no amount of transaction data can provide.
Cooling Off and Drifting Away (lapsed customers who were still within reach): These customers had not ordered in 91 to 270 days but were not yet gone. The window to retain them was still open, and the approach was personal rather than automated. The sales team enrolled them in loyalty programs tailored to their profile: 5+1 free drink cards for occasional visitors, subscription plans for nearby office workers who had reduced their frequency, and loyalty rewards for regulars showing early signs of disengagement. The key was matching the offer to the behavior pattern the data revealed.
VIP Regulars (current, frequent, high spenders): These were the best customers the business had. The strategy was simple: make them feel valued without asking for anything. Once a month, VIP Regulars received a surprise complimentary cookie or pastry with their order. No opt-in, no coupon to redeem, just a genuine thank-you. The cost was minimal. The signal it sent was not.
Promising Newcomers (current customers with only one to three orders): These were recent visitors who liked the shop enough to create an account but had not yet formed a habit. We targeted them with upsell offers and seasonal specials - a new drink to try, a pastry pairing, a limited-time flavor - timed to arrive shortly after their last visit. The goal was to turn a first impression into a second visit, and a second visit into a routine.
Lost (dormant, low spend, lowest priority): Automated retargeting ads at minimal cost. These customers had low lifetime value and had been inactive the longest, so the investment matched the expected return.
The key principle: each segment gets a treatment proportional to its value and its likelihood of responding. The assignment happens automatically based on data, and the system scales without adding headcount.
Result
Remember the original question: are there customer segments that are not properly served?
The answer was yes, and the scale was larger than anyone expected. Nearly 25,000 previously valuable customers had gone cold with zero outreach. The segmentation made that visible, and each campaign addressed a different part of the problem.
The automated SMS reactivation for Gone Cold customers delivered:
- 80% open rate (compared to a typical 20-30% for bulk SMS campaigns)
- 25% click-through rate
- 10% discount code redemption rate
The timed delivery made a measurable difference. Sending messages right before each customer's historical visit window produced open rates far above industry average.
The sampled phone calls to Gone Cold customers generated something the owner had never had access to before: direct feedback on why people left. Competitor mentions, service complaints, and pricing concerns that could now be acted on - insight that no amount of automated messaging can surface.
Meanwhile, the loyalty programs for Cooling Off and Drifting Away customers gave the sales team a reason to re-engage in person, with offers that matched each customer's history. And the small gestures for VIP Regulars reinforced the relationships that mattered most.
The overall business impact:
- 10% reduction in customer churn across the identifiable customer base.
- 12% revenue increase directly attributable to the combined reactivation and retention strategy.
Beyond the initial results, the system runs continuously. New customers are automatically scored and segmented as they accumulate orders. When any customer's recency score crosses a threshold, the appropriate workflow triggers without manual intervention. The owner no longer has to guess which customers need attention - the system surfaces them before they are lost for good.
Technologies and Tools
- Server: Linux (stability, security, and performance for ETL workloads)
- Database: MySQL (centralized customer and order data)
- Data Sources: POS Orders API (Square), Account Management System
- Segmentation: RFM Analysis (Recency, Frequency, Monetary scoring)
- Campaign Automation: Twilio SMS API (automated triggers based on segment rules)
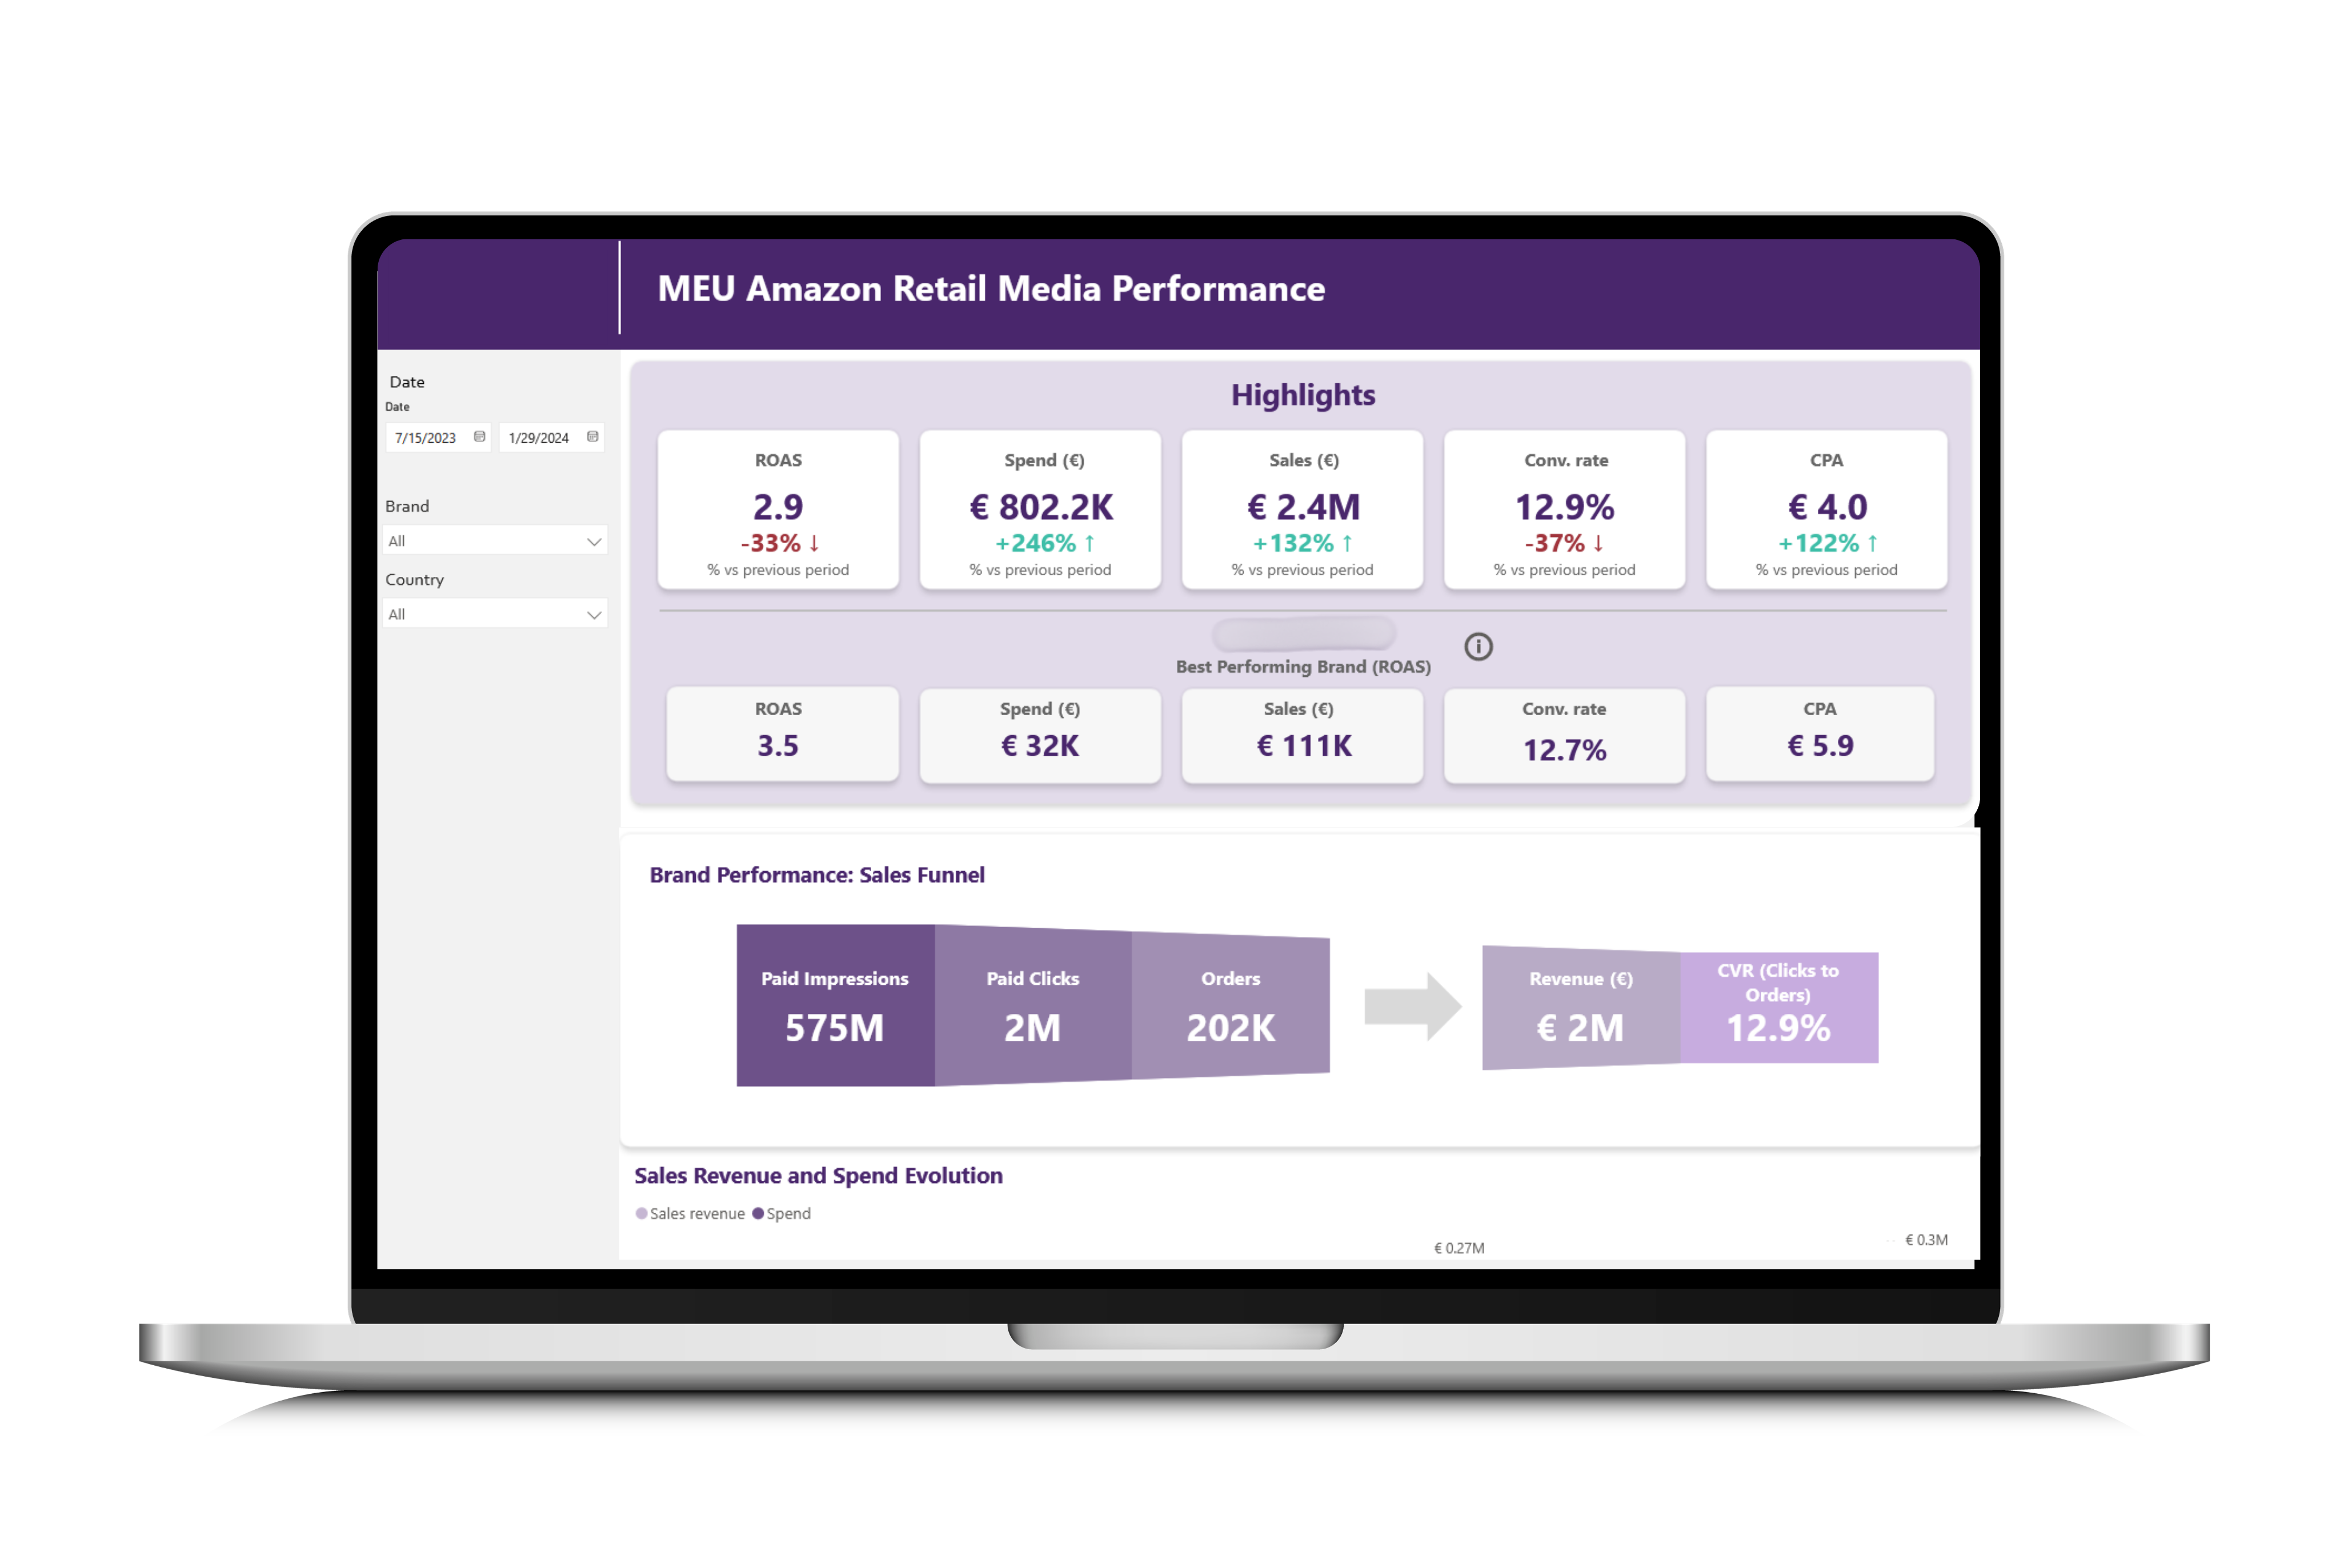
- Visualization: Business intelligence dashboards in PowerBI for segment monitoring