Business Intelligence Services
Get rid of endless Excel and Google Sheets documents
Visualize data from multiple sources on custom dashboards for meaningful insights using business intelligence tools like Power BI, Tableau, Domo, and Looker. Benefit from fast delivery, flexible pricing, and the right mix of technologies.
Contact Us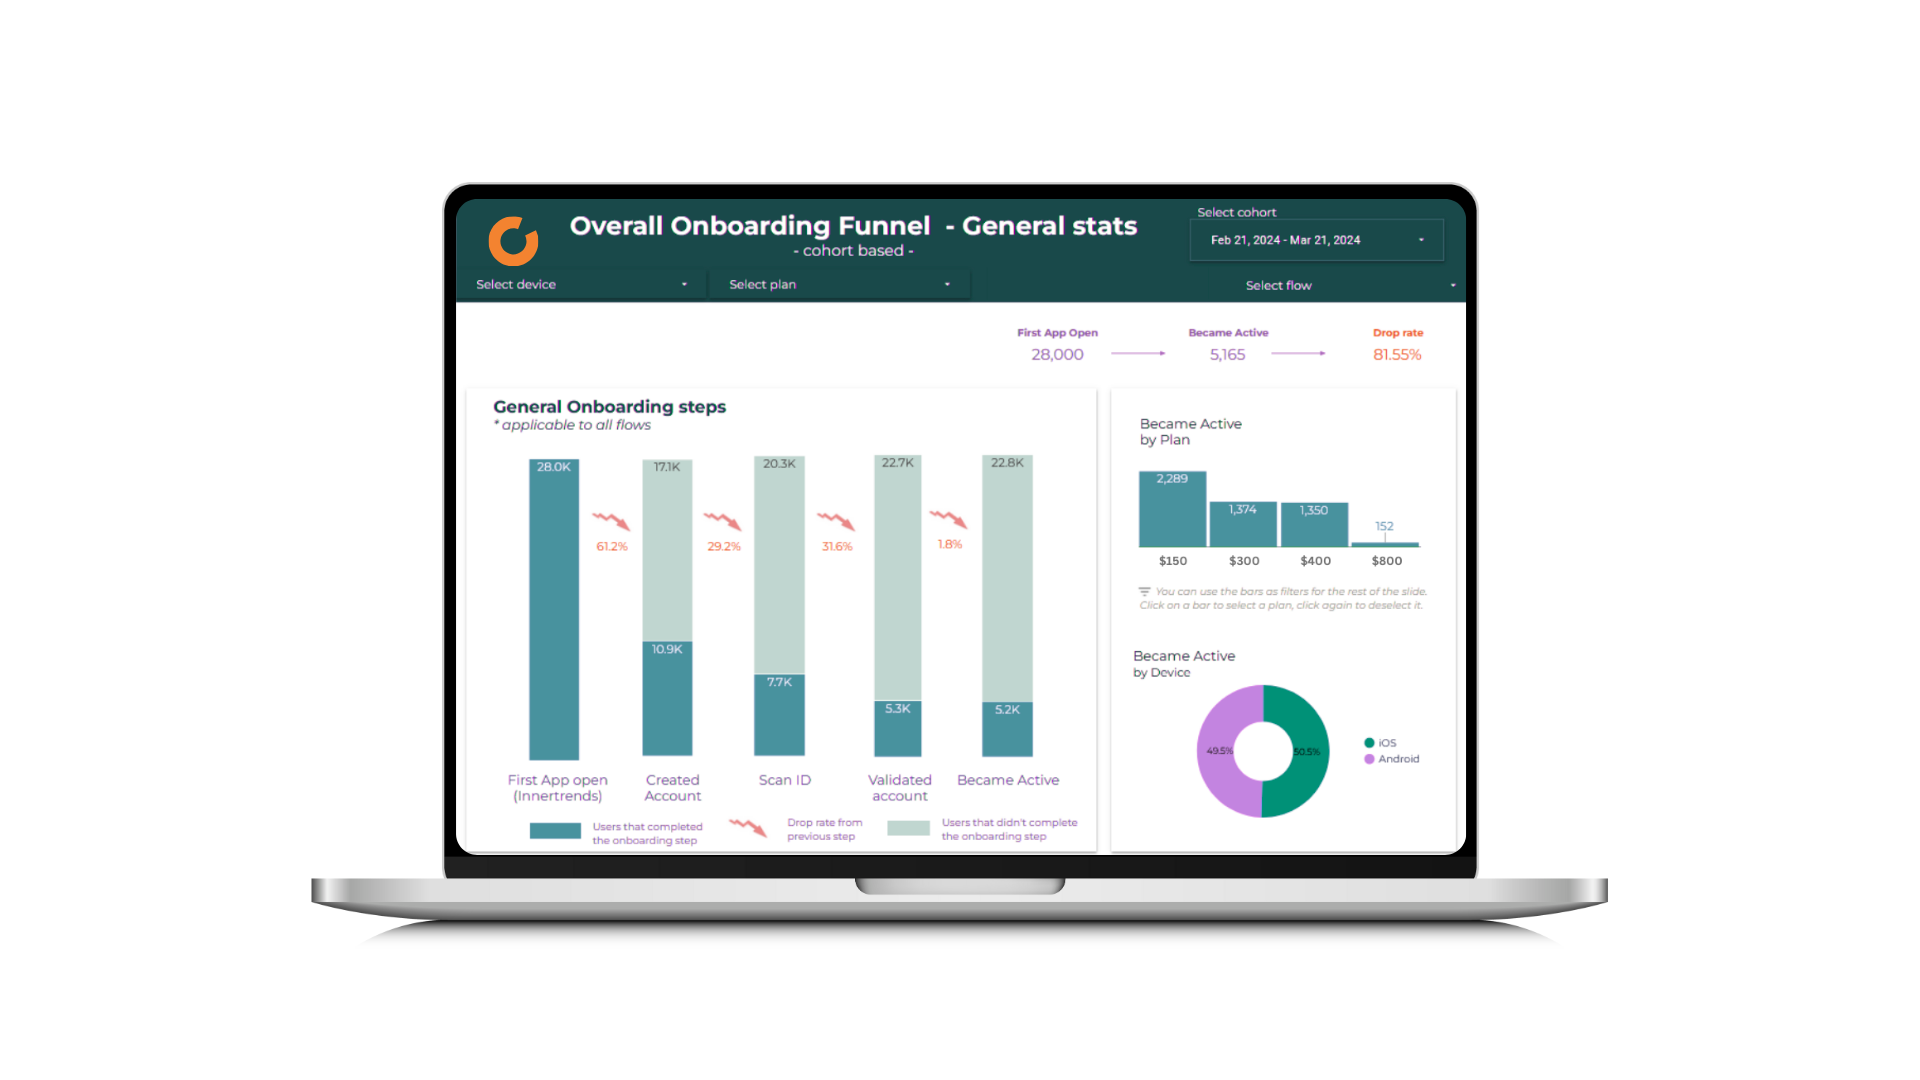
Business Intelligence Services We Offer
BI Consulting & Strategy
We assess your current analytics maturity, define a BI roadmap aligned with business goals, recommend the optimal platform, and design the data architecture so every dollar goes toward dashboards people actually use.
Dashboard Development
We build interactive dashboards on Power BI, Tableau, Domo, or Looker that connect to your live data sources, giving every stakeholder self-service access to the KPIs that drive decisions.
BI Platform Migration
Outgrown your current tool, or stuck on a legacy system? We migrate reports, data models, and user permissions to a modern BI platform with minimal downtime and zero data loss.
Embedded Analytics & White-Label BI
We embed interactive reports directly into your SaaS product, client portals, or internal tools, letting your users consume analytics without ever leaving your application.
BI Support & Optimization
Ongoing monitoring, performance tuning, new dashboard requests, and data source maintenance. We keep your BI environment healthy and evolving as your business grows.
Conversational Analytics & Agentic BI
Layer AI agents on top of your governed Power BI, Tableau, or Snowflake models so business users can ask questions in plain language and get answers grounded in your real numbers. Part of our AI agent development practice.
Read more →When Do You Need Our Business Intelligence Services?
- You understand the transformative power of data but aren't harnessing it for strategic decisions.
- Your team is drowning in Excel and Google Sheets reports that are slow, error-prone, and manual.
- You need to consolidate data from multiple sources into a single point of truth.
- Stakeholders keep requesting new dashboards and reports faster than your team can deliver.
- You need real-time visibility into KPIs that reveal patterns pivotal to your business's success.

Why Choose Witanalytica for Business Intelligence?
+18 Years of BI Experience
Nearly two decades of building reports and dashboards in Excel, Power Pivots, Tableau, Domo, Looker, Looker Studio, PowerBI, QlikSense, and IBM Cognos.
Technology Agnostic
We always choose the BI platform that makes the most sense for your business, not the one that pays us the most. We are not resellers for any vendor.
Cross-Department Expertise
We have built dashboards for Executive, Marketing, Sales, Finance, Supply Chain, and Operations departments across multiple industries.
Adoption-First Mindset
A dashboard nobody uses is wasted money. We combine data visualization best practices with end-user requirements to ensure the reports we deliver actually get adopted across your organization.
Our 7 Steps Dashboard Development Process
We start by conducting a discovery meeting to understand the reporting needs, document key performance indicators (KPIs), metrics, and the methodology. During and after the meeting, we review the existing input and output files such as CSVs, Excel spreadsheets, Google Sheets, etc.
We then document a high-level structure of the report that documents the tabs, views and chart types that we will use on each page.
We work our way back, identify and access the required data sources and systems. We analyze the available data against report requirements to identify any gaps.
If the dashboard calls for structured data that is not readily available in a data lake, database or data warehouse, we translate our reporting needs into technical requirements for your data engineering team. If they are overloaded or you do not have a data engineering team, we can take care of the data extraction and integration ourselves.
We build the report, making sure to frequently show you our progress so we can swiftly incorporate your feedback.
When the report is ready, we perform a quality check to ensure the methodology is aligned and we display the same numbers as in your original reports. After this, we wait for end user acceptance and sign off that the report meets their requirements.
After we deliver the report, we monitor the dashboard usage and its performance to ensure tangible positive results and a great user experience. We adjust the report as underlying data sources change and evolve.
We start by conducting a discovery meeting to understand the reporting needs, document key performance indicators (KPIs), metrics, and the methodology. During and after the meeting, we review the existing input and output files such as CSVs, Excel spreadsheets, Google Sheets, etc.
TESTIMONIALS
Witanalytica has been an awesome team to work with. They have such a talented team with a broad range of expertise in software development, BI and data analysis - which have all been instrumental in helping us achieve our technical goals. We truly value their partnership and look forward to continuing to work together.
Gregg Bansavage
CIO, RBW Logistics
Witanalytica has been an excellent partner in managing and optimizing our Tableau environment. Their team’s technical expertise and proactive support have streamlined our reporting processes, improved dashboard performance, and provided valuable insights to our business. Their responsiveness and deep understanding of data analytics make them a trusted extension of our own team.
Mark Lack
Director of Data Analytics and AI, The Ubique Group
Witanalytica helped us transition from Excel to a dynamic dashboard, allowing us to view all the relevant data and the KPIs that we track as a business. Instead of having our developers code an interface for weeks, we can now instantly accomplish this process through an interface, eliminating the need for manual coding.
Radu Albastroiu
Startup Founder, masinilacheie.ro
Witanalytica’s expertise in big data engineering and visualization complements our digital media audit and customer analytics services. Collaborating with them allows us to deliver end-to-end analytics solutions and services, without the risks and investments associated with building these capabilities in-house.
Silviu Toma
Senior Partner, Microanalytics
Working with Witanalytica has transformed our approach to reporting. Their expertise in PowerBI enabled us to go beyond the limited capabilities of Excel, allowing us to provide our clients with dynamic and visually captivating PowerBI dashboards. This capability has facilitated rapid testing, iteration, and the collection of customer feedback to improve our platform.
Alin Rosca
Startup Founder, RepsMate
Working with Witanalytica has been a consistently positive experience. They are responsive, professional, and approach every revision with patience and precision. What sets them apart is a strong understanding of supply chain management, inventory planning, and sales operations, which makes collaboration efficient and ensures deliverables align with real business needs. They have also worked effectively across multiple departments in our organization and manage a 6-7 hour time zone difference seamlessly. I would confidently recommend them to any organization seeking a skilled and dependable analytics partner.
Rubin Chen
Supply Chain VP, The Ubique Group
BI Platforms We Work With
Power BI
Best for Microsoft ecosystem users. User-friendly dashboards with DAX, Power Query, and seamless Excel integration at $10/user/month.
Tableau
Renowned for dynamic, diverse visualizations and extensive connectivity. Suited for detailed data exploration and complex calculations.
Domo
Cloud-native platform known for handling large volumes of data. Optimal for enterprises needing embedded analytics and data apps.
BI Tool Cost Calculator
Estimate and compare licensing costs across leading business intelligence platforms. Adjust your team size and select the tools you are considering.
Pricing data last updated: 2026-03-27
Disclaimer: These estimates are for informational purposes only. Witanalytica is not a reseller of any BI platform. We strive to keep pricing data accurate and up to date, but actual costs may vary based on region, contract terms, and vendor promotions. Please confirm directly with each vendor before making purchasing decisions.
Quick presets
Compare tools
Annual Cost Comparison
AWS QuickSight
Amazon (AWS)
$150/month
10 Creators x $0 + 50 Viewers x $3
Pros
- +Cheapest reader pricing ($3/mo or $0.30/session)
- +Serverless, auto-scaling
- +Deep AWS integration
Cons
- -Limited customization vs Tableau/Power BI
- -Requires AWS ecosystem
- -Less intuitive UI
Watch out for
- !Amazon Q enablement fee: $250/mo if using Author Pro
- !SPICE capacity beyond 10GB/author
+1 more in detailed report
Power BI
Microsoft
$840/month
60 users x $14
Pros
- +Lowest per-user cost among major BI tools
- +Deep Microsoft 365 integration
- +Large community and ecosystem
Cons
- -All viewers need paid licenses (unless Premium Capacity)
- -1GB dataset limit on Pro tier
- -Gateway complexity for on-premise data
Watch out for
- !Microsoft 365 license often needed ($20-57/user/mo)
- !Data gateway management ($15K-30K/yr for enterprise)
+1 more in detailed report
Tableau
Salesforce
$1,905/month
10 Creators x $75 + 15 Explorers x $42 + 35 Viewers x $15
Pros
- +Best-in-class data visualization
- +Large community and resources
- +Cross-platform data source support
Cons
- -Expensive at scale (Creator at $75/mo)
- -Annual billing commitment required
- -Steep learning curve for advanced features
Watch out for
- !Training: $1,200-$2,000 per course, $3K-5K per analyst for full certification
- !Server infrastructure costs (if on-premise)
+1 more in detailed report
Looker
$5,550/month
$5,550/mo platform fee
Pros
- +Strongest semantic layer (LookML)
- +Excellent data governance
- +Deep GCP/BigQuery integration
Cons
- -Very expensive ($60K+/yr minimum)
- -Requires SQL developers for LookML
- -No self-service signup or free trial
Watch out for
- !LookML development: $50K-70K/yr in developer time
- !BigQuery compute: $50K-200K/yr for most orgs
+1 more in detailed report
Download Your Detailed Comparison Report
Get a PDF with all tiers, hidden costs, and vendor-specific negotiation tips you can use when speaking with sales teams.
Free. Just enter your email to download.
Our Business Intelligence Pricing Models
Transparent pricing built for long-term partnerships, not one-off transactions.
On-Demand Expertise
All tasks are tracked, and the corresponding invoice of the delivered services is billed monthly.
| Activity | Hourly Rate |
|---|---|
| AI Agents Development and Implementation | $100 |
| Data Engineering & Database Administration | $110 |
| Business Intelligence Reporting | $90 |
| Data Science | $120 |
Reserved Capacity Agreement
- Pre-purchase a package of monthly working hours that guarantees reserved capacity and priority availability, regardless of our workload.
- Because this capacity is exclusively allocated to you, unused hours do not carry over to the following month.
| Hours Package | Price |
|---|---|
| Every 50 hours | $4,500 10% savings |
Alternatively, we also offer project-based pricing
For well-defined engagements, we scope the full project upfront and agree on a fixed fee, so you know exactly what to expect.
Case Studies for Business Intelligence Services
Explore real life case studies and see how we delivered measurable outcomes in similar situations.
Showing 12 case studies

Inventory Lot Size Optimization for a Global Industrial Manufacturer
How a global manufacturer freed working capital and recovered warehouse space by optimizing SAP lot sizes using demand variability analysis and a repeatable Alteryx-to-Tableau analytics workflow.
Read case study →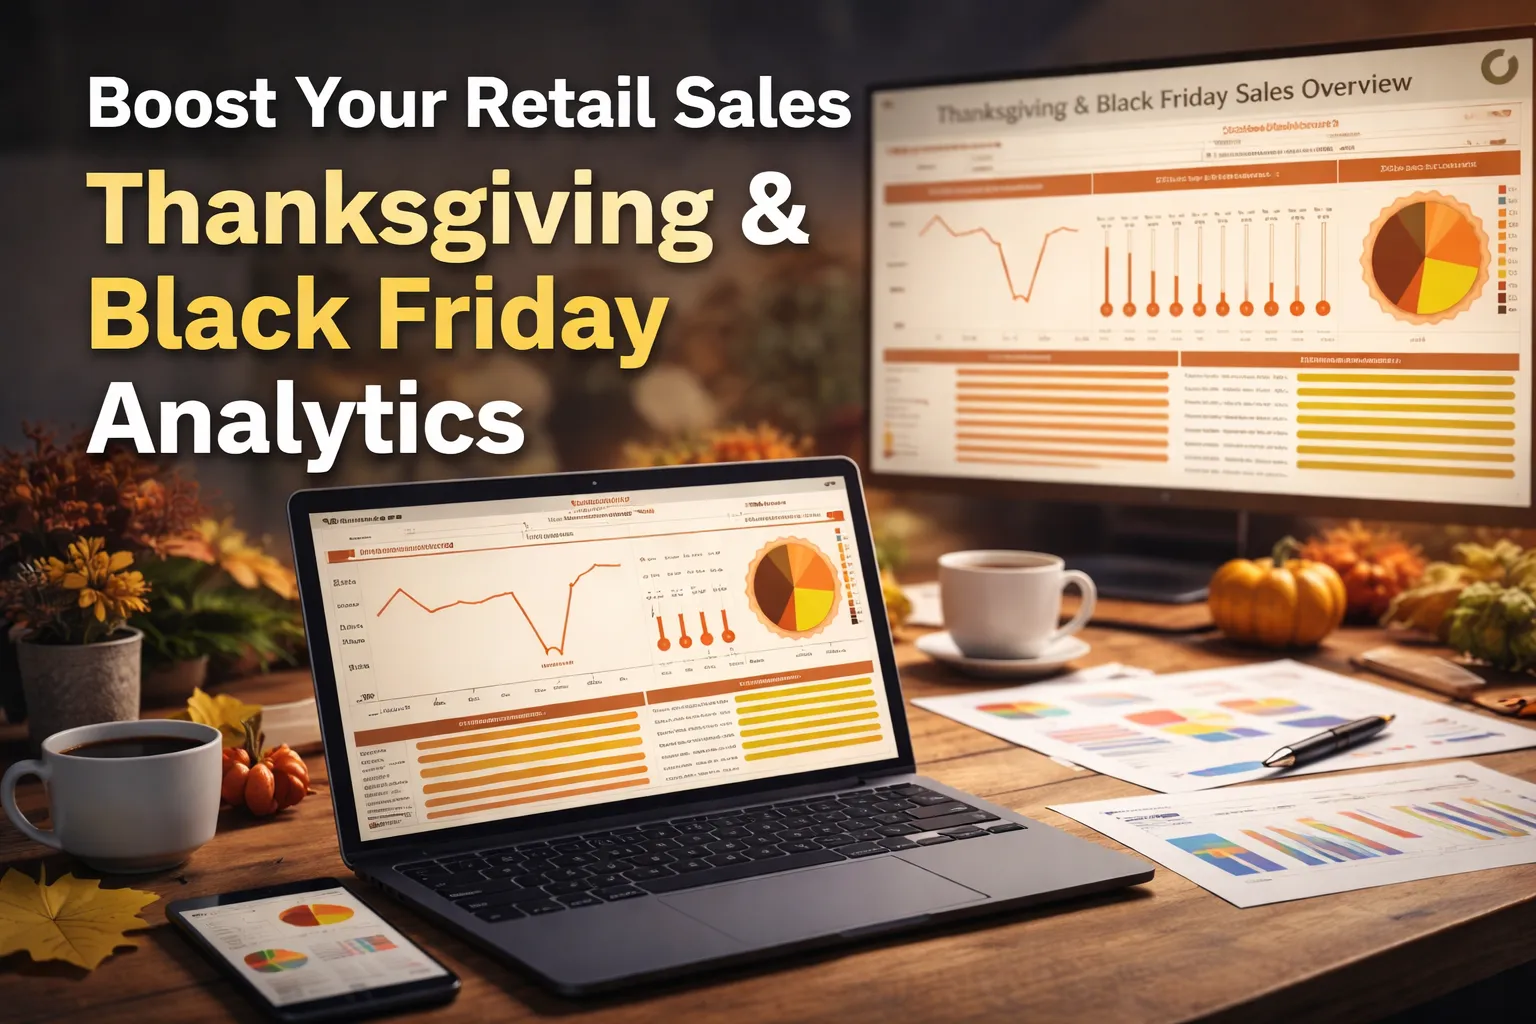
Thanksgiving & Black Friday Sales Analytics: Real-Time Campaign Monitoring
A real-time Tableau dashboard on Salesforce and SQL Server data helped a retailer monitor hourly Black Friday sales and plan next year's strategy.
Read case study →
3PL Digital Transformation: Data Analytics & Automated Invoicing
Discover how a U.S. 3PL company eliminated revenue leakage, automated invoicing, and gained real-time margin visibility.
Read case study →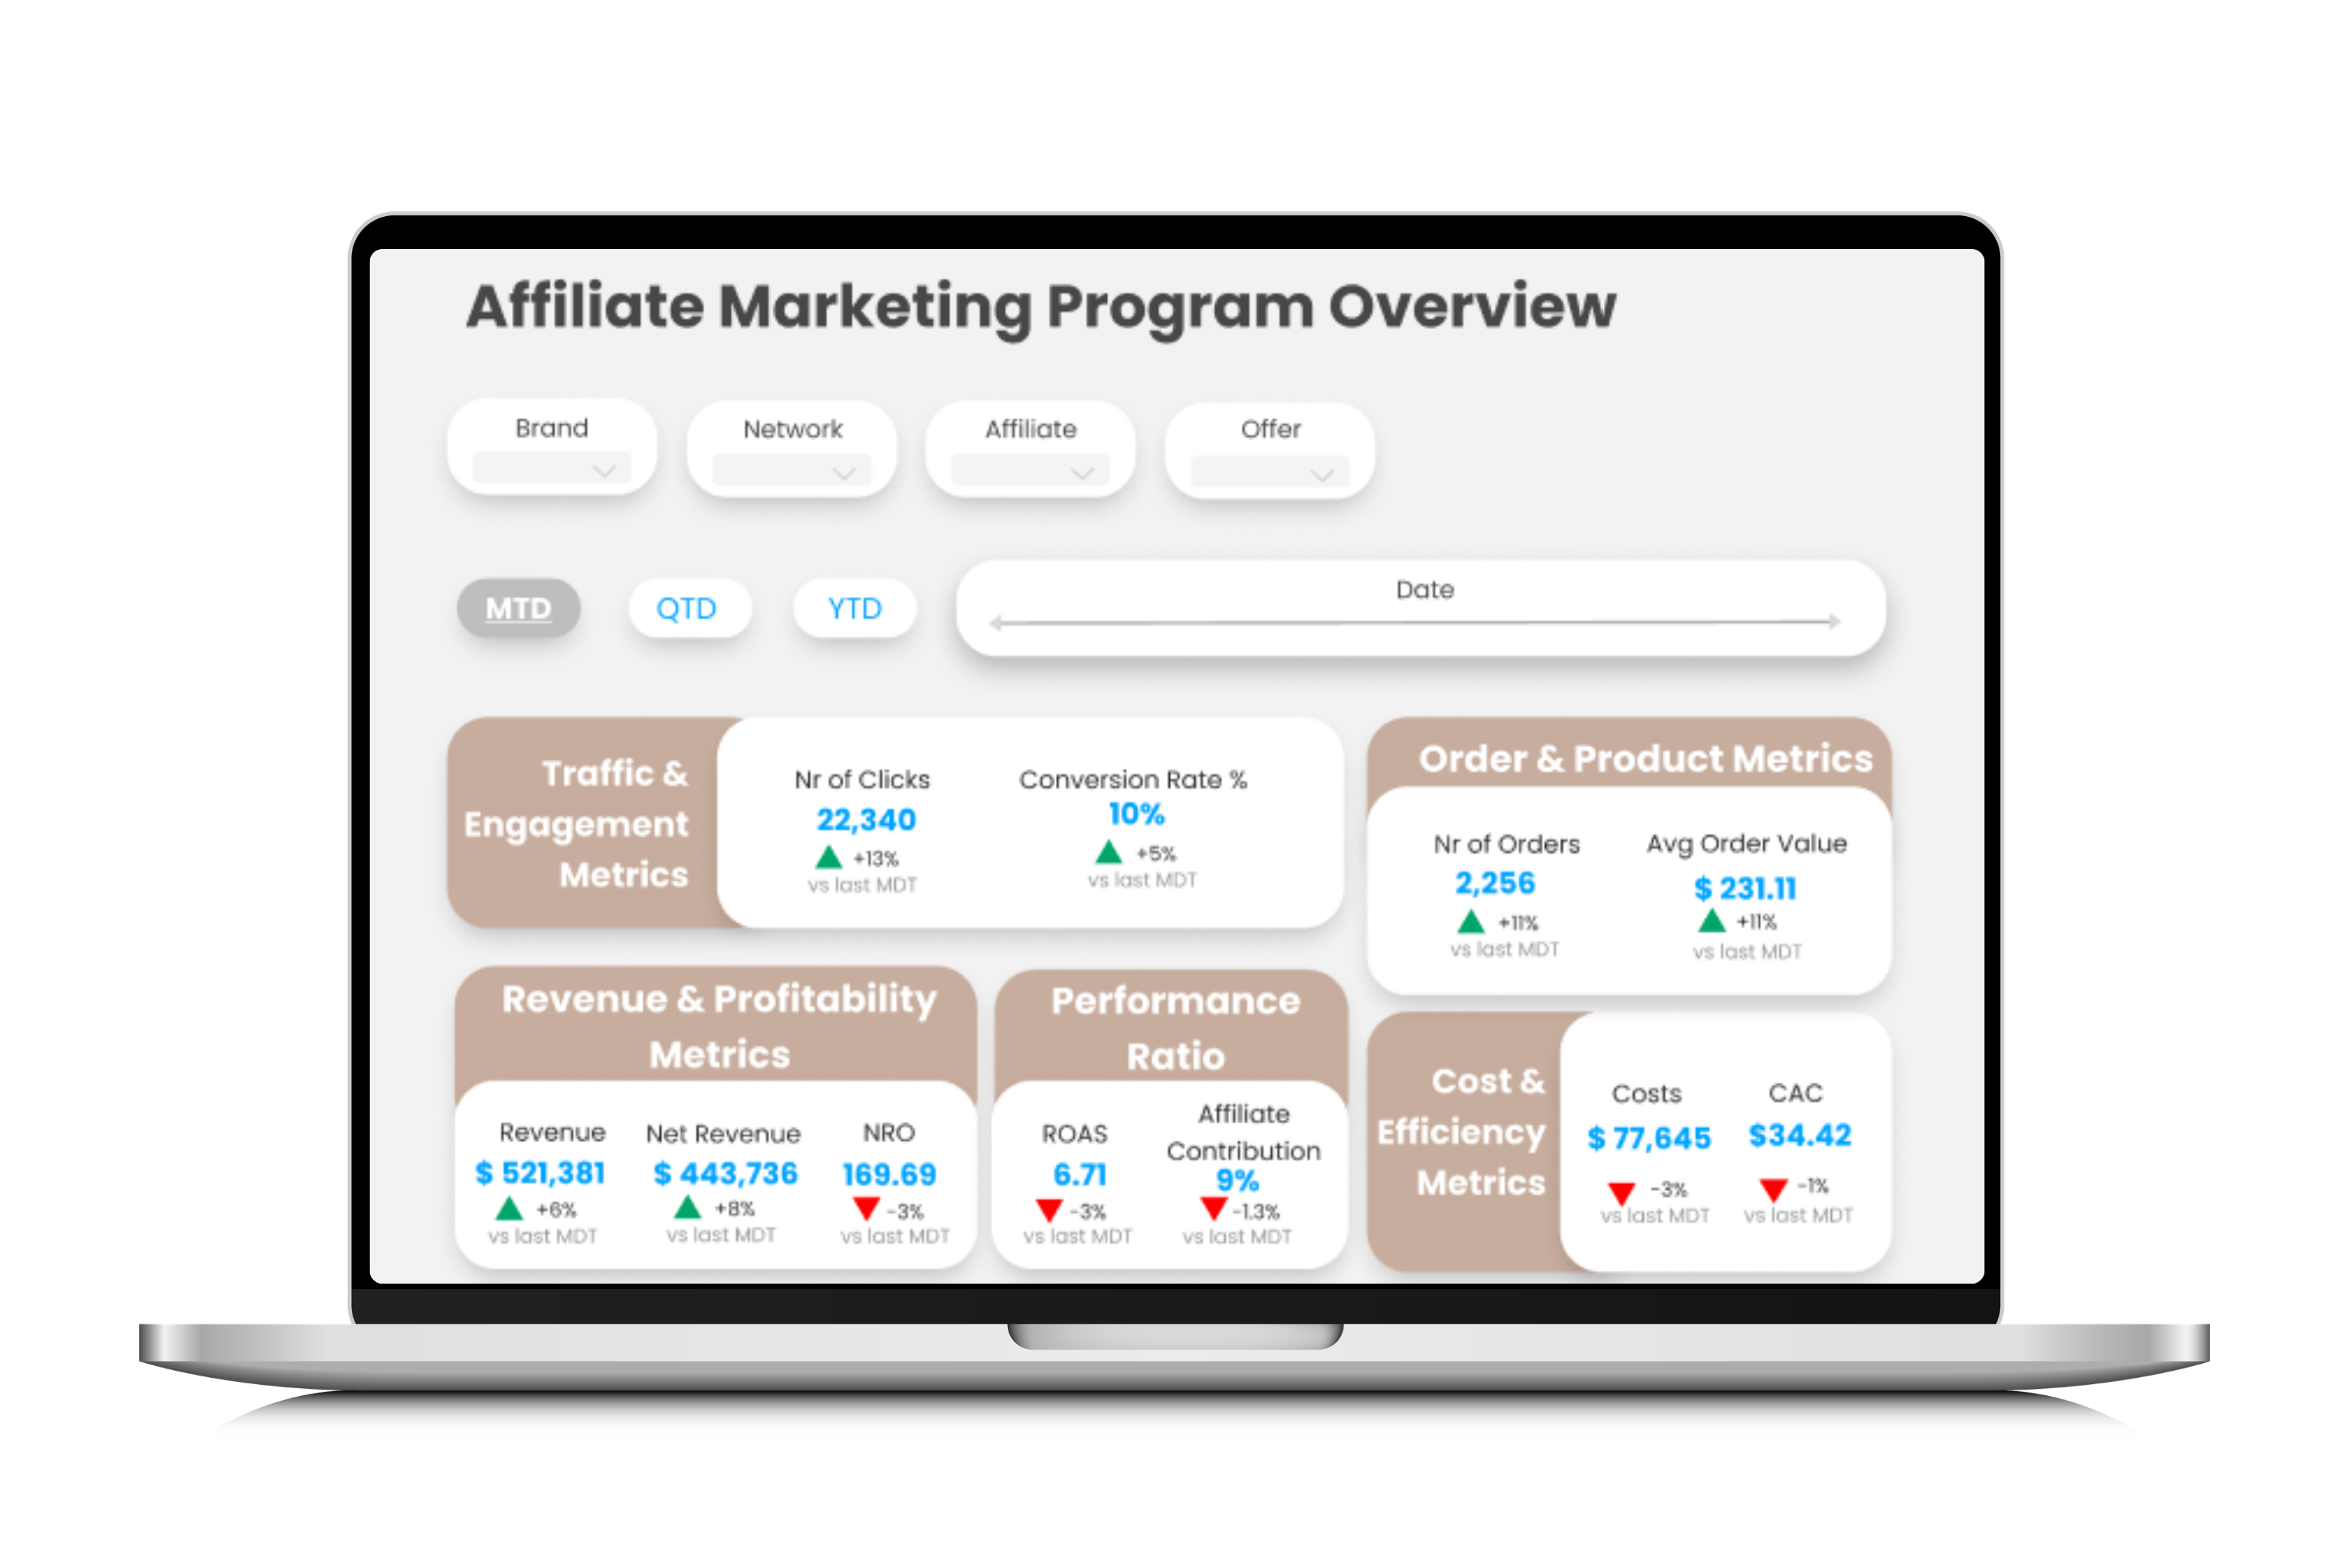
Affiliate Marketing Dashboards: Unified Performance Tracking
Learn how affiliate teams replaced spreadsheets with unified dashboards to track performance across networks, identify profit leaks, and optimize ROAS.
Read case study →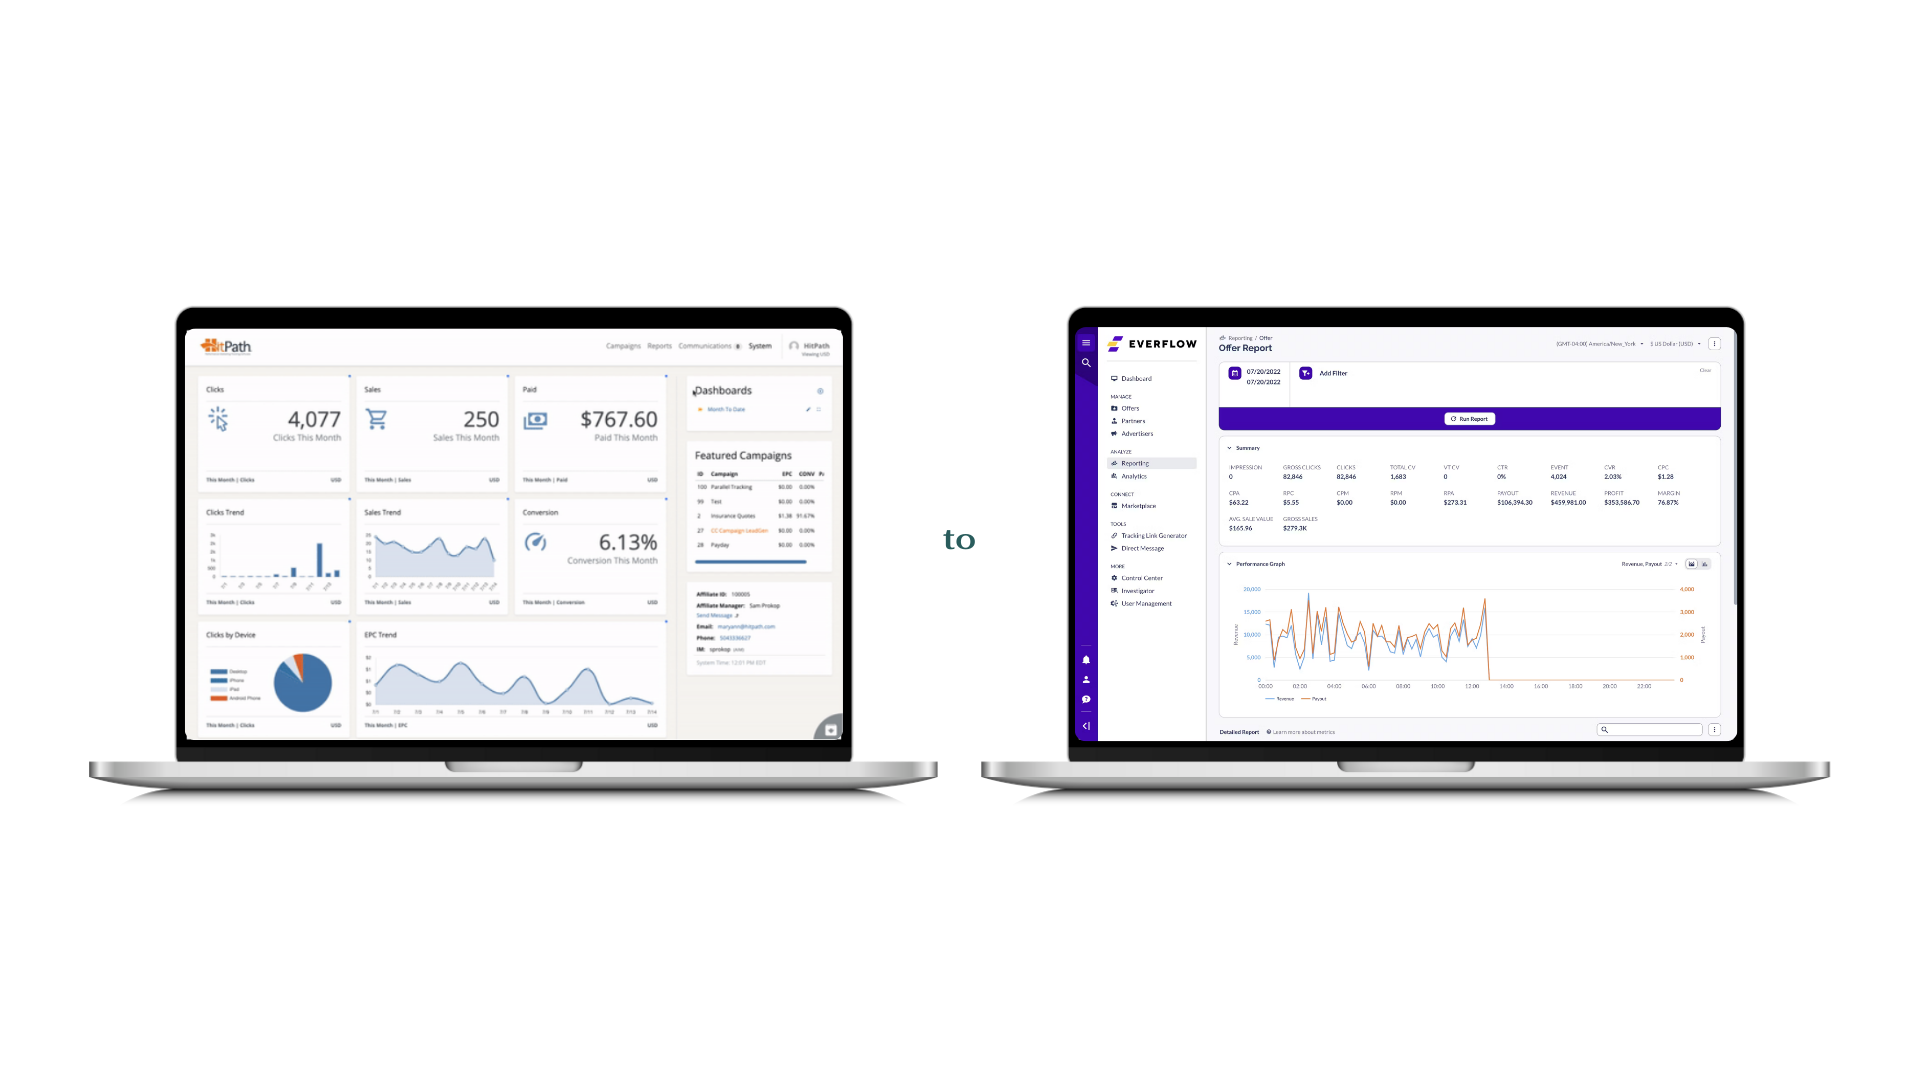
HitPath to Everflow BI Migration for Affiliate Tracking
Unified HitPath and Everflow data into one BI system with migration monitoring dashboards, ensuring reporting continuity throughout the platform transition.
Read case study →
Email Marketing Data Management for Affiliate Publishers
How we helped email marketing publishers manage high-volume campaign data with scalable pipelines, centralized storage, and automated BI reporting.
Read case study →
Multi-Channel Retail Profitability: Amazon vs Wholesale Analytics
A US retailer used Tableau to compare Amazon and wholesale profitability, uncovering margin differences that reshaped their distribution and pricing strategy.
Read case study →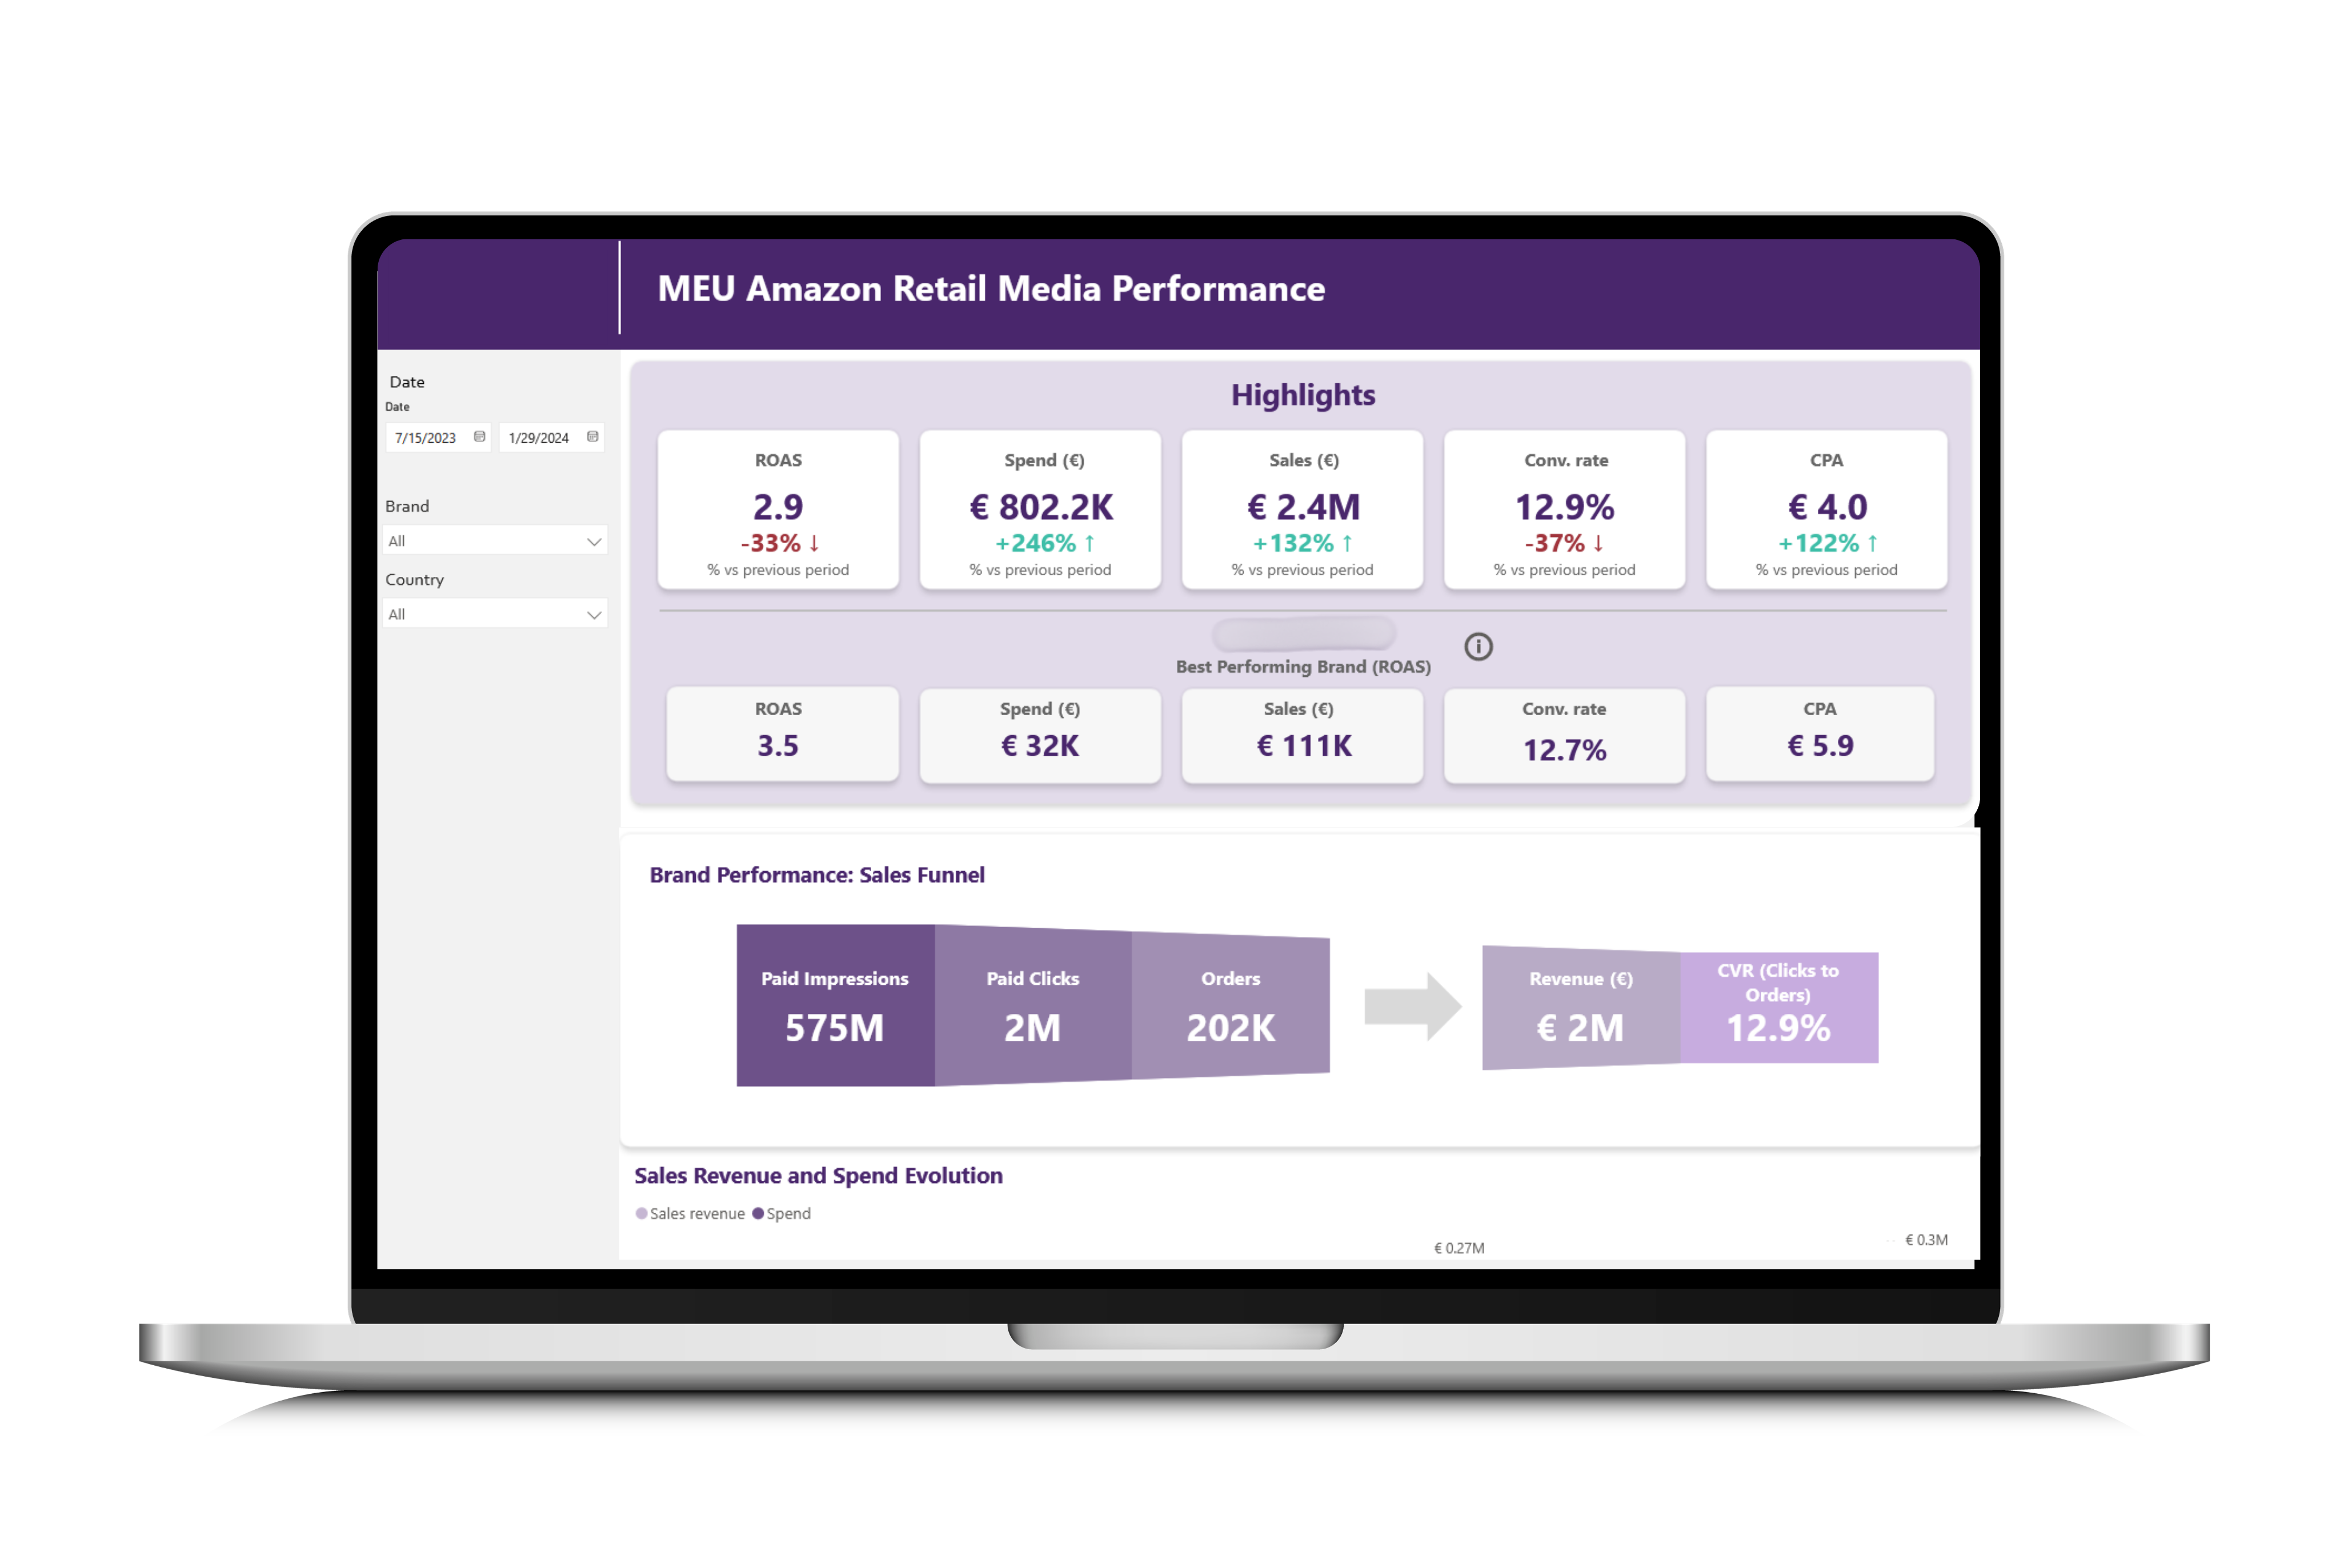
Amazon Ads Reporting with Power BI for Food & Beverage
How a snack manufacturer replaced manual Amazon Ads tracking with automated Power BI dashboards to optimize spend, measure ROAS, and guide marketing decisions.
Read case study →
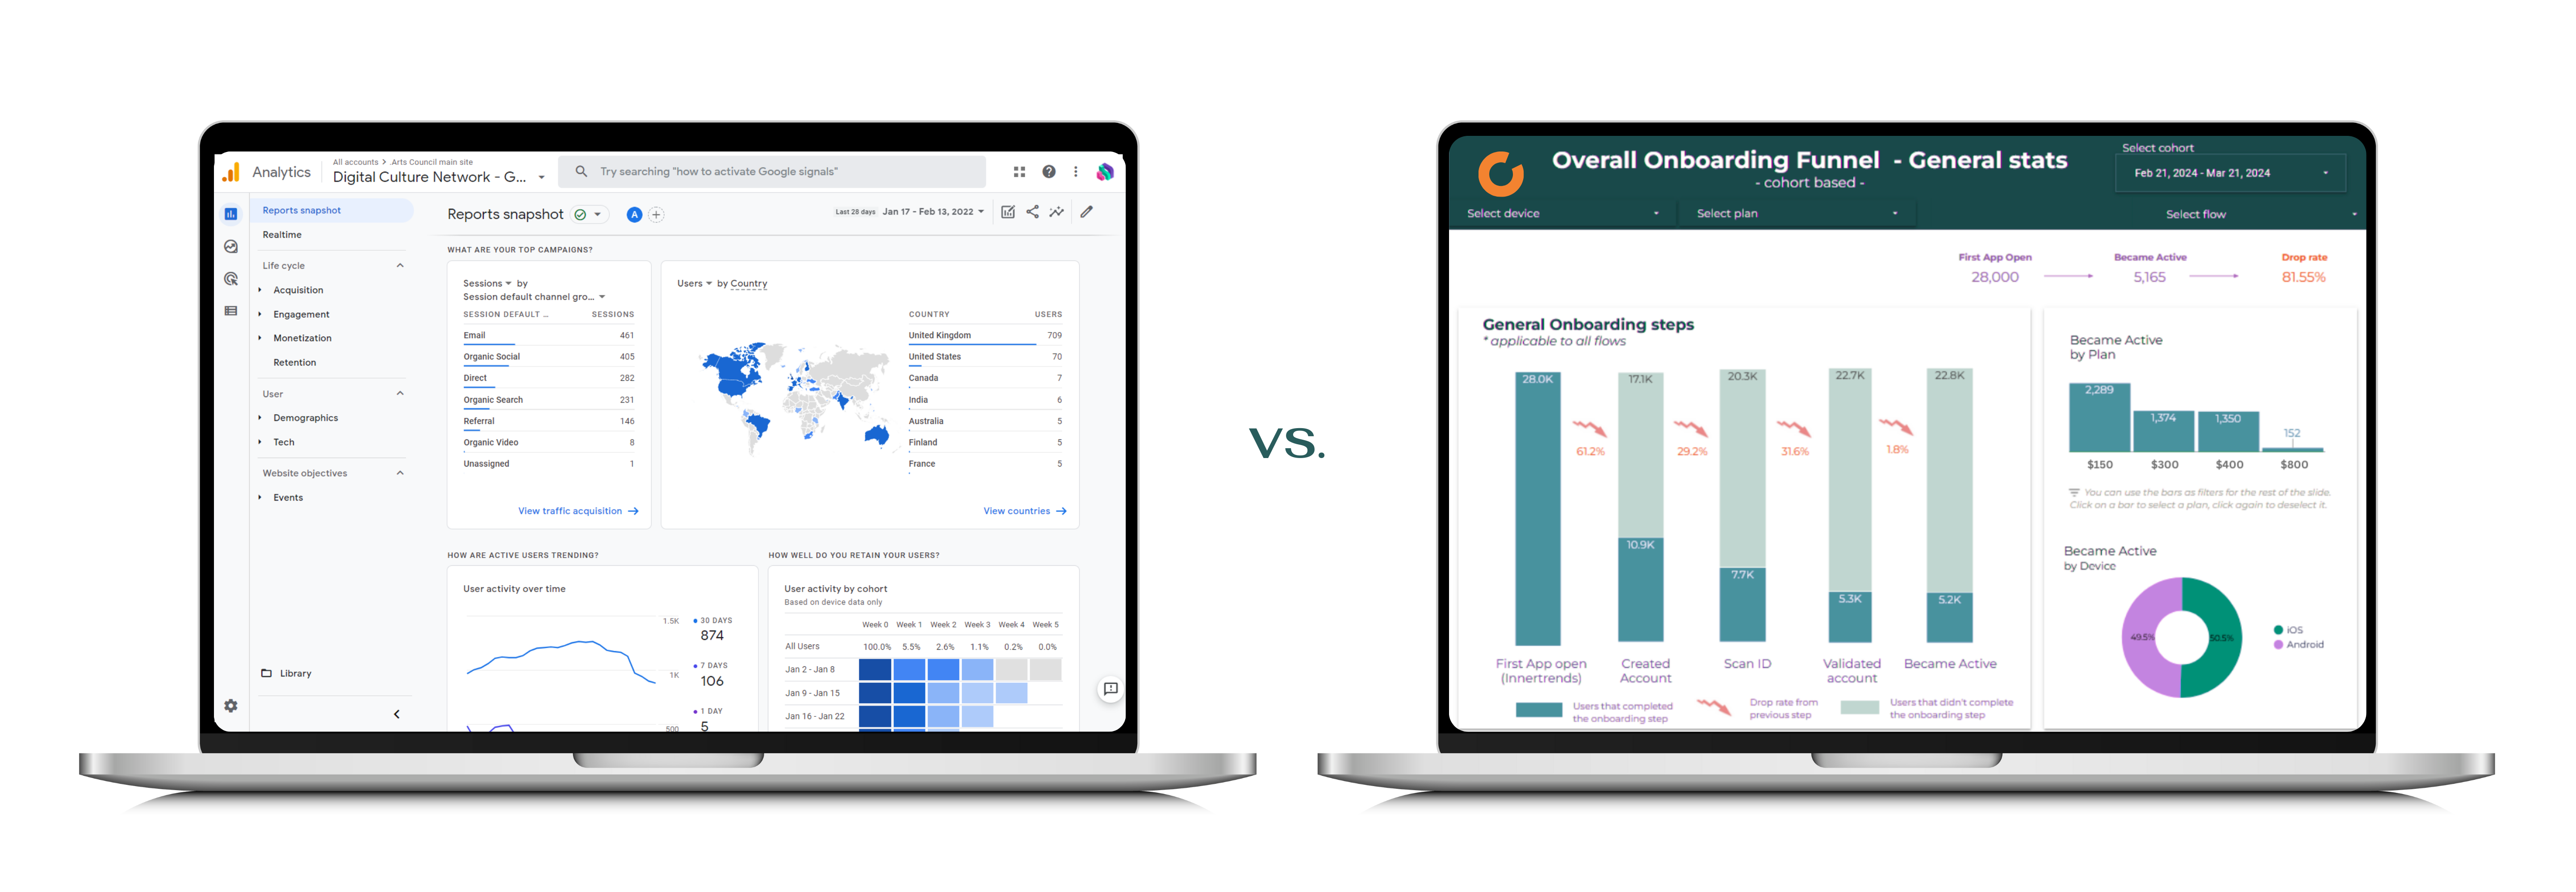
Healthcare Data Warehouse: Unifying GA4, App Analytics and CRM in BigQuery
How we built a BigQuery data warehouse for a European healthcare clinic, unifying GA4, mobile app analytics, CRM and 10+ paid media platforms to expose onboarding drop-off and enable churn modeling.
Read case study →
Car Rental Marketplace BI: Startup Analytics with Power BI
We built the analytics stack for a car rental marketplace using MongoDB, Python, MariaDB, and Power BI to centralize operations and enable data-driven growth.
Read case study →
BI Finance Reporting for a Multinational Affiliate Network
Automated multinational financial consolidation for a US affiliate network. Replaced manual spreadsheets with dynamic BI dashboards for revenue and margins.
Read case study →
Marketing Automation with RFM Segmentation for a Coffee Chain
How we helped a coffee shop chain connect POS data, build RFM segmentation, and automate SMS campaigns that reduced churn by 10% and grew revenue 12%.
Read case study →Related Articles
Explore insights and guides related to our business intelligence practice.
20 articles

How to Deploy Data Analytics in Manufacturing: From Shop Floor to Boardroom
A practical guide to deploying data analytics in manufacturing logistics and supply chain, built around the five-tier meeting structure that actually runs modern factories. From shift-level dashboards to multi-plant regional operations, powered by a single source of truth.

GA4 vs Power BI vs Databases: OLTP, OLAP, and Schemas Explained
GA4, Power BI, and BigQuery handle data differently. Understand schemas, OLTP vs OLAP trade-offs, and when to use each type of data product in your stack.

Self-Service Analytics vs. Professional Analytics: How to Choose the Right Approach
Not every analytics problem needs a data team, and not every problem can be solved with a spreadsheet. This decision framework helps you determine when self-service tools are enough and when you need professional analytics support.

Inventory Analytics: Classification, Safety Stock, Consignment, and the KPIs That Matter
How to use data analytics for inventory classification, safety stock calculation, consignment stock management, and the KPIs that separate reactive planning from strategic inventory control.

Online-to-Offline Retail Analytics: Using Digital Data to Improve In-Store Experience
Online shopping behavior reveals in-store opportunities. Eight data-driven strategies that bridge digital analytics and physical retail to improve merchandising, layout, and customer experience.

Automate Excel and Google Sheets Reports with BI Tools
Still pasting data into spreadsheets weekly? Power BI, Tableau, and Domo automate reporting with live connections and scheduled refreshes. Here's how.
BI Tools vs Web Apps: When to Use Each (Decision Guide)
BI tools and web apps serve different purposes. Learn when to use Power BI or Tableau for analytics vs. custom web applications for operational workflows.

Healthcare Data Analytics: Patient Outcomes and Operations
Healthcare generates vast data. Analytics improves patient outcomes, optimizes resource allocation, reduces readmissions, and supports regulatory compliance.

Immersive Analytics: VR and AR for Field Operations
VR, AR, and mixed reality are changing how field teams interact with operational data. Explore use cases in energy, manufacturing, and logistics.

Why Digital Marketing Agencies Need Data Analytics Partners
Marketing agencies excel at campaigns but often lack data engineering depth. Partnering with analytics specialists fills the gap and improves client outcomes.

Automate Power BI Dashboards: Stop Manual Excel Reporting
Manual Excel reporting wastes hours weekly. Automate Power BI dashboards with proper data pipelines, scheduled refreshes, and a scalable architecture.
Domo Pricing and Features: Cloud BI Platform Guide
Evaluating Domo for your BI stack? This guide breaks down pricing tiers, core features, data integration, and how Domo compares to Power BI and Tableau.
Your Goals, Our Expertise
We start from your strategic objectives and work our way back to the right mix of solutions and technologies, not the other way round.
Book a Consulting CallFrequently Asked Questions
Business intelligence (BI) services provide organizations with a comprehensive view of their operations and performance by consolidating business data into a single point of truth. It allows businesses to analyze data and information to make informed decisions and improve business processes.
BI services enhance decision-making by offering quick and reliable data processing, allowing for faster and more informed business decisions through the analysis of historical and real-time data.
A business intelligence services company is responsible for gathering, storing, analyzing, and reporting data findings to its customers, continually monitoring data collection, and developing methodologies to improve data analysis.
The four concepts of business intelligence are data collection, analysis, visualization, and decision-making. Data is gathered from various sources, analyzed to derive valuable insights, visualized for easy understanding, and used for strategic decision-making.
When adopting BI services, businesses commonly face challenges including data overload, data silos, poor data quality, low employee adoption rates due to lack of data literacy, and ensuring data security on mobile platforms.
When you have amassed a large volume of business data that is not utilized in making decisions.
When you cannot keep up with user requests for new dashboards and reports.
When you are tired of Excel running slow and not being able to process more than 1 million rows.
If you need a broad range of analytics skills, flexible and scalable support, and want to benefit from cross-industrial experience without the commitment of hiring full-time staff, outsourcing to an agency is the right choice. Agencies offer diverse expertise, cross-industry experience, flexible engagement models, scalability, and high availability. If you prefer embedded expertise and are prepared to invest in hiring and training, building an in-house team could be beneficial.
Our services cater to mid-sized companies that have reached an inflection point where they can no longer effectively manage operations, sales, and marketing using Excel and Google Sheets. We cover data analytics consulting, data engineering, database administration, business intelligence and data science — either as a full architecture setup or as targeted modular services.
Our greatest differentiator is how we mix data visualization best practices with user requirements. With close to 20 years of experience building reports and dashboards across PowerBI, Tableau, Domo, Looker, QlikSense and IBM Cognos, we know that adoption is ensured when user requirements are met with data visualization best practices.
We have worked with Affiliate Marketing, FMCG, Healthcare, Manufacturing, Transportation, Logistics, SaaS, Media and Advertising, Retail, and E-commerce companies. Visit our industries page to see detailed solutions and case studies for each vertical.
It depends on your ecosystem, team skills, and budget. Read our product roundup comparison of Domo vs Tableau vs PowerBI. This is not a decision to be treated lightly — migrating 1–2 years down the line to a different platform can cost over $200K.
No. The moment you need to customize, blend and join data sources or perform a decent table calculation, it falls short.
We start by shadowing and understanding your process, then document the necessary tabs, visuals, functionalities and KPIs. We propose a report structure, identify the necessary data sources, develop the dashboard, and perform quality checks. We develop dashboards by mixing best practices with user requirements to ensure clarity and user-friendliness.
Yes. BI tools allow for a wide degree of customization. When we develop a dashboard, we implement your company's branding guidelines. Reports and dashboards are a great opportunity to showcase your brand, especially when they are public-facing.
Usually no — designing in Figma requires double the effort, duration and costs. Dashboard development is straightforward enough that you can witness the stages and provide feedback we swiftly incorporate. However, if you really need a mock-up first, we can design in Figma.
Yes. This is known as writeback capability. Very few BI tools support it — notably PowerBI (with PowerApps) and our partners at scaidata.com. However, you might be looking for a web application instead. Check our guide that highlights the differences between BI tools and web apps.
We create custom ETL scripts that extract data from NoSQL sources and transform complex, nested documents into structured formats. for certain scenarios like real-time monitoring, alternatives such as Grafana, Kibana, or Apache Superset may be more suitable than traditional BI platforms.
You have complete ownership and control over the architecture and data. Our team operates within your infrastructure using SSH keys, VPNs, IP whitelisting, OAuth APIs, and data encryption in transit and at rest. Our processes align with GDPR and CCPA, and we welcome third-party security audits.
We offer two engagement models with transparent pricing.
On-Demand Expertise
All work is tracked and billed monthly at hourly rates:
- AI Agents Development and Implementation - $100/hr
- Data Engineering & Database Administration - $110/hr
- Business Intelligence Reporting - $90/hr
- Data Science - $120/hr
Reserved Capacity Agreement
- Pre-purchase a 50-hour monthly package at $4,500 (10% savings)
- Guaranteed priority availability regardless of our workload
We also offer project-based pricing for well-defined engagements.
Contact us to discuss the best fit for your needs.
For a single dashboard, it can range from a few days to two weeks. Comprehensive projects covering dashboards for multiple departments may span several months. We scale our resources to meet project deadlines.
It starts with an initial consultation, followed by a tailored proposal, contract finalization, then onboarding and data integration, solution implementation, training and capacity building, and ongoing support and optimization.
We adhere to stringent data quality standards focusing on accuracy, completeness, consistency, and reliability. Our process involves rigorous data validation, mandatory fields, data cleaning tools, standardization across systems, and regular data refresh schedules and audits.
We actively monitor dashboards for alerts and triggers. Maintenance of existing dashboards takes precedence. We offer flexible support from fixed maintenance fees to time-and-material billing. We measure and monitor solution usage to ensure adoption and value delivery.