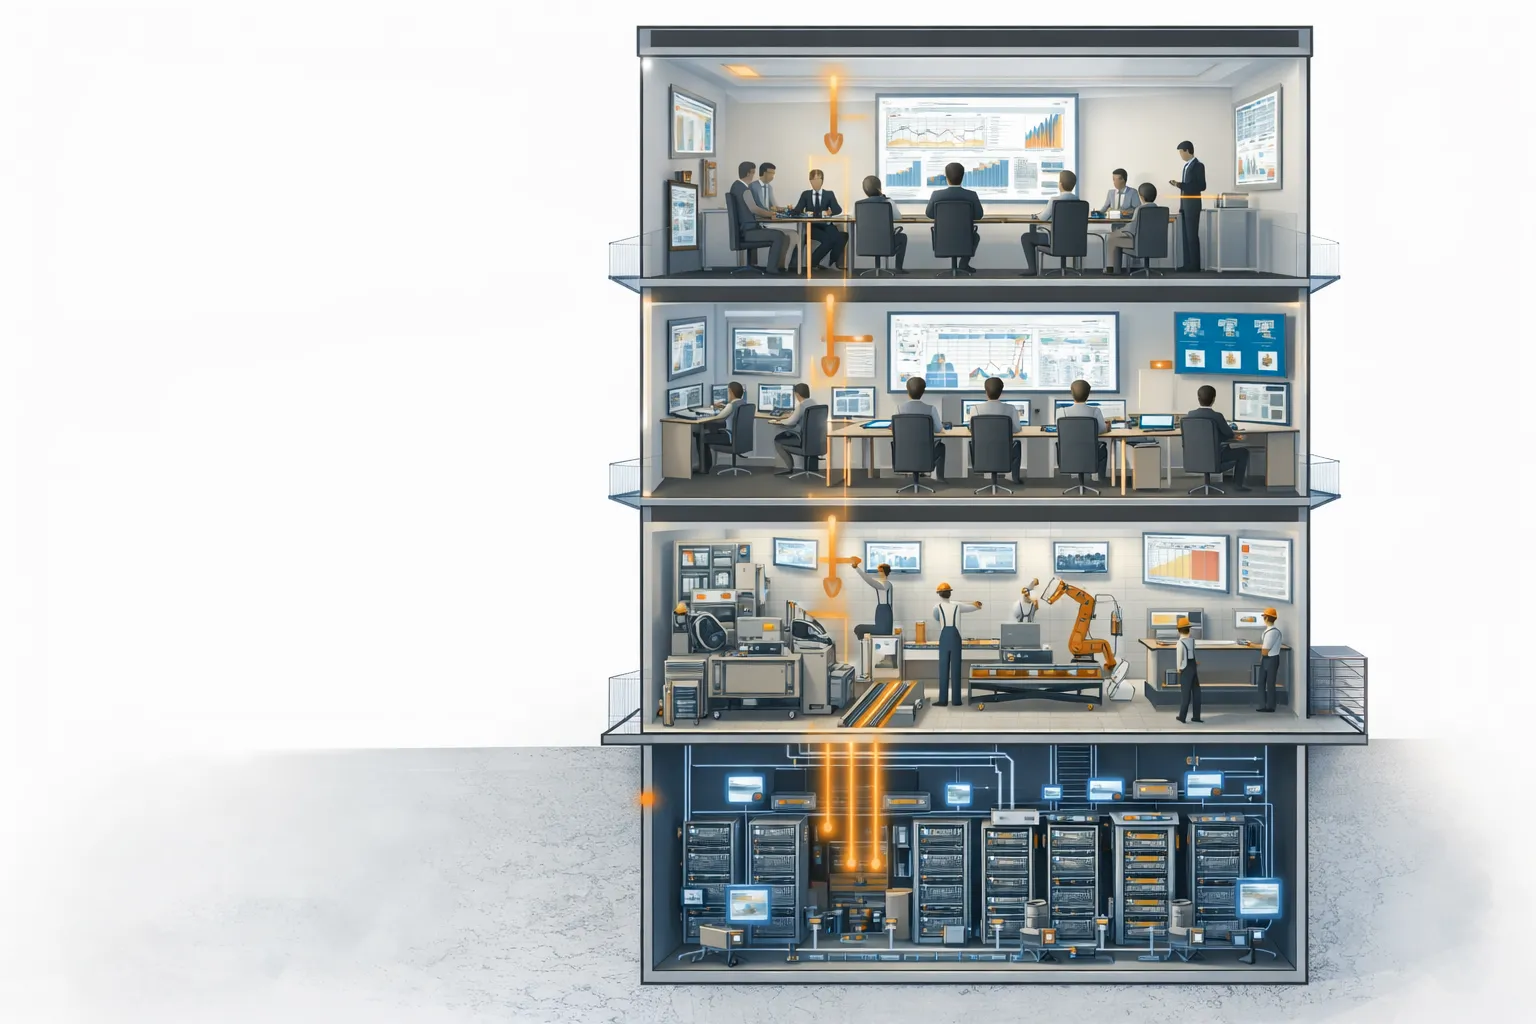
Field operations in energy, manufacturing, and logistics share a common problem: the people who need data most are furthest from where it lives. A maintenance technician standing next to a malfunctioning compressor cannot pull up a Power BI dashboard effectively on a phone screen while wearing gloves. A warehouse supervisor walking a 200,000 square-foot facility needs to see inventory discrepancies overlaid on the physical space, not buried in a tabular report back at a desk.
This is the problem that immersive analytics - VR, AR, and mixed reality applied to data visualization - is built to solve. Not as a novelty, and not as a replacement for traditional BI tools, but as a delivery mechanism that puts data where physical work happens.
VR, AR, and Mixed Reality: What Each Does Differently
These three technologies get grouped together, but they solve different problems:
Virtual Reality (VR) replaces the physical environment entirely with a digital one. The user puts on a headset and interacts with a fully synthetic space. For analytics, this means walking through three-dimensional data visualizations, exploring models of equipment or facilities, and running simulated scenarios. VR works best in training, planning, and design contexts where the physical environment is not needed during the analysis.
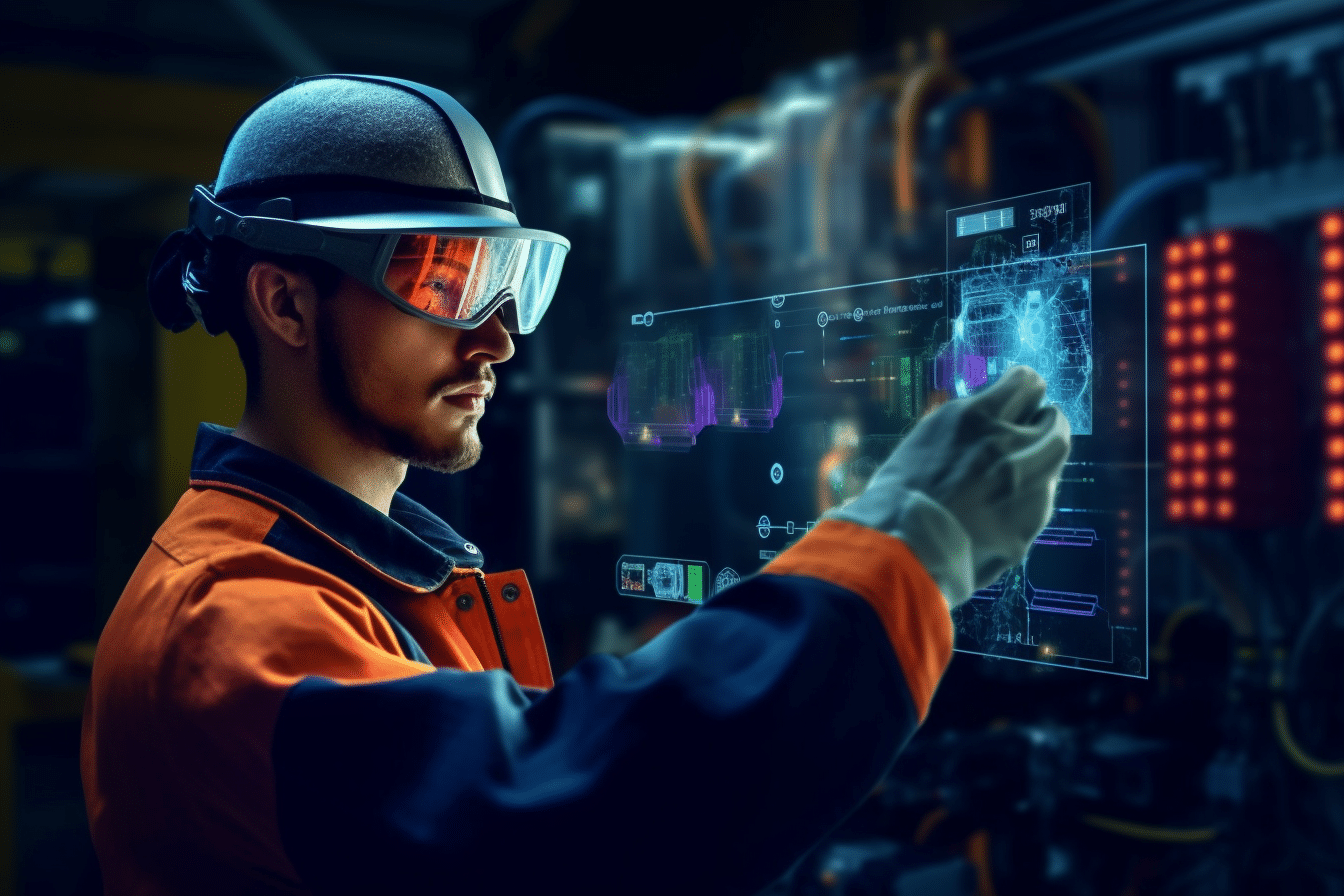
Augmented Reality (AR) overlays digital information onto the real world, typically through a phone, tablet, or lightweight glasses. A field technician pointing a tablet at a piece of equipment can see its maintenance history, live sensor readings, and operating parameters floating next to the physical machine. AR preserves the real-world context and adds data to it.
Mixed Reality (MR) goes further than AR by anchoring digital objects in the physical space so they behave as if they exist there. A holographic dashboard pinned to a factory wall stays in place as the user walks around. Digital annotations attached to specific pipes or valves remain positioned correctly relative to the physical infrastructure. Devices like Microsoft's HoloLens 2 and Meta Quest Pro with passthrough mode are the current generation enabling this.
The practical distinction: VR is for immersive analysis away from the field. AR is for data overlays in the field. MR is for interactive data objects anchored to physical assets.
Where This Is Already Working
Immersive analytics has moved beyond proof-of-concept in several industries. The deployments that have gained traction share a common trait: they address scenarios where traditional dashboards physically cannot reach the user at the moment of decision.
Oil, Gas, and Energy
Offshore platforms and remote energy facilities were among the earliest adopters. Shell and BP have both deployed AR-assisted inspection systems where technicians wearing smart glasses can see equipment identifiers, historical failure data, and real-time sensor readings overlaid on physical infrastructure. Instead of radioing back to a control room to ask for the maintenance log on a specific valve, the technician sees it projected directly onto the valve.
More advanced MR implementations overlay predictive maintenance scores onto equipment. A compressor flagged by a machine learning model as having elevated vibration patterns gets a visual indicator visible through MR glasses - before it has actually failed. This shifts the inspection workflow from scheduled rounds to targeted inspections based on data.
Manufacturing
On production floors, AR is being used for quality control, assembly guidance, and real-time performance monitoring. BMW's production lines use AR glasses that show assembly instructions overlaid on the actual workpiece, reducing error rates and training time for new workers.
For analytics specifically, MR dashboards mounted at production line stations let shift supervisors see yield rates, defect counts, and equipment OEE (Overall Equipment Effectiveness) without leaving the floor. The data updates in real time from the same underlying pipeline that feeds the plant's traditional BI reports. The difference is in the delivery: the data meets the supervisor where they work, rather than requiring a trip to a desktop in an office.
Logistics and Warehousing
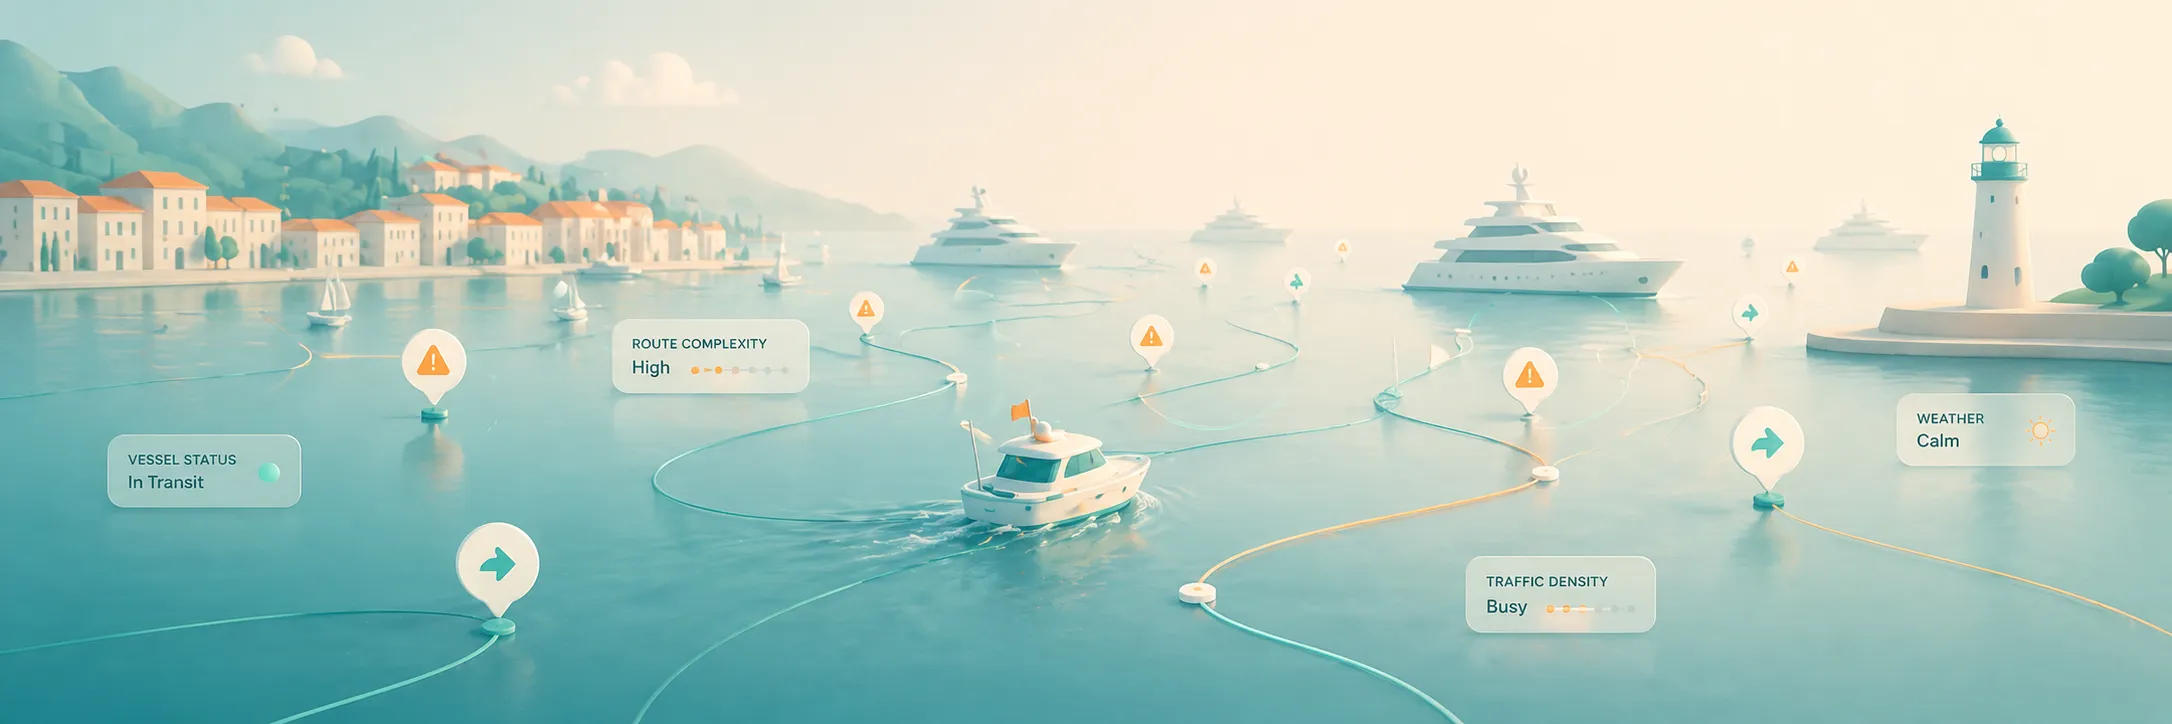
AR-guided picking in warehouses is one of the most commercially mature use cases. DHL deployed AR smart glasses in multiple facilities, projecting optimal walking paths and bin locations directly into the picker's field of view. The analytics layer shows real-time throughput, pick accuracy rates, and zone bottleneck data to warehouse managers through the same AR platform.
The more advanced application is spatial analytics: overlaying inventory data, movement patterns, and storage utilization metrics onto the physical warehouse space itself. Instead of looking at a heat map on a desktop monitor that represents zones abstractly, a logistics manager can walk through the warehouse and see utilization and movement density visualized directly on the racks and aisles.
The Technical Requirements
Making immersive analytics work in field environments requires more than just a headset and a dashboard. Several infrastructure components must exist:
Real-time data pipelines. Field AR/MR applications need data that is current to the minute or second, not batch-refreshed overnight. This means streaming architectures - Kafka, Flink, or similar platforms - feeding the visualization layer. A maintenance AR overlay showing yesterday's sensor data is less useful than one showing current readings.
Edge computing. In many field environments - offshore platforms, remote manufacturing plants, underground mines - cloud connectivity is unreliable. Processing data at the edge (on-site servers or even on the device itself) ensures the AR overlay works even when the network drops. This is a non-negotiable requirement for safety-critical applications.
Spatial mapping and anchoring. For MR to pin digital objects to physical assets, the device needs a spatial understanding of the environment. Technologies like LiDAR scanning and simultaneous localization and mapping (SLAM) allow the device to track its position relative to physical objects and keep digital overlays aligned. This requires initial environment mapping, which adds a deployment step that traditional BI does not have.
Data model integration. The AR/MR application needs to know which data belongs to which physical asset. This means linking the visualization layer to an asset management system, a digital twin, or at minimum a structured equipment registry with unique identifiers. Without this mapping, the overlay has no way to know that the pressure reading on screen X belongs to the compressor the technician is standing in front of.
What Holds It Back
Immersive analytics is not a mainstream enterprise tool yet. The reasons are practical, not technological:
Hardware maturity. Current MR headsets are still bulky for extended wear in hot, physically demanding environments. Battery life on devices like HoloLens 2 tops out around 2-3 hours of active use. Industrial-rated AR glasses that can handle dust, heat, and impact are available but expensive and limited in display capability.
Content creation costs. Building an AR/MR analytics experience is significantly more expensive than building a traditional dashboard. The spatial UI design skills required are rare, the development toolkits are less mature than those for web-based BI, and testing requires physical presence at the deployment site.
ROI justification. For organizations already running functional BI reporting, the incremental value of immersive delivery needs to be demonstrated concretely. Where it works best - hazardous environments, complex spatial data, large-scale field operations - the ROI case is strong. For a standard office-based analytics use case, traditional tools remain more cost-effective.
Organizational readiness. Field teams that have been working with paper checklists and radio communication do not adopt MR overnight. Change management, training, and gradual rollout are essential - the same adoption challenges that any analytics transformation involves, amplified by unfamiliar hardware.
The Realistic Outlook
Immersive analytics will not replace traditional BI. It extends BI into environments where screens and desks are not available. The organizations that will benefit most are those with large field workforces, complex physical infrastructure, and operational data that has more value at the point of action than in a boardroom.
The technology is real, the use cases are proven in specific verticals, and the hardware is improving rapidly. For companies in energy, manufacturing, logistics, and similar industries, the question is not whether immersive analytics will become relevant to their operations, but when their data infrastructure and organizational maturity will be ready to support it. The smartest preparation is not buying headsets. It is building the real-time data pipelines, asset registries, and data quality foundations that any immersive application will require.