As companies increasingly rely on data to drive decision-making, the selection of the right business intelligence (BI) tool becomes crucial. While there are several BI tools available, including PowerBI, Tableau, and Looker Studio (formerly known as Google Data Studio), not all are created equal. This article focuses on why PowerBI and Tableau, renowned for their robust functionality, are superior choices to Looker Studio when dealing with complex data analysis tasks.
PowerBI and Tableau are celebrated for their capability to delve deep into complex datasets, providing powerful visualization features that simplify data interpretation. On the other hand, Looker Studio (formerly known as Google Data Studio), primarily designed for small to medium-sized businesses using Google Analytics, offers a straightforward, yet comparatively basic, analysis and visualization tool.
Handling Complex Data Sets
A significant advantage of PowerBI and Tableau is their ability to handle complex data sets. These tools can manage large volumes of data from a plethora of sources, offering a comprehensive data view. PowerBI and Tableau can seamlessly integrate data from diverse sources, such as spreadsheets, databases, and cloud-based applications like Salesforce, AWS, and Azure.
For example, suppose your data includes web analytics from Google Analytics, customer data from Salesforce, and financials from an SQL database. With PowerBI or Tableau and an underlying data warehouse, you can blend this data to create a holistic customer profitability analysis - a task that Looker Studio would struggle to execute due to its limited data source integrations and blending capabilities.
Custom Reports and Dashboards
PowerBI and Tableau also shine in their ability to create custom reports and dashboards. They offer extensive customization options, including the ability to create intricate charts, graphs, and visualizations. For instance, in Tableau, you can create a Sankey diagram to display customer journeys or a radial tree diagram to show hierarchical relationships, something not possible with Looker Studio.
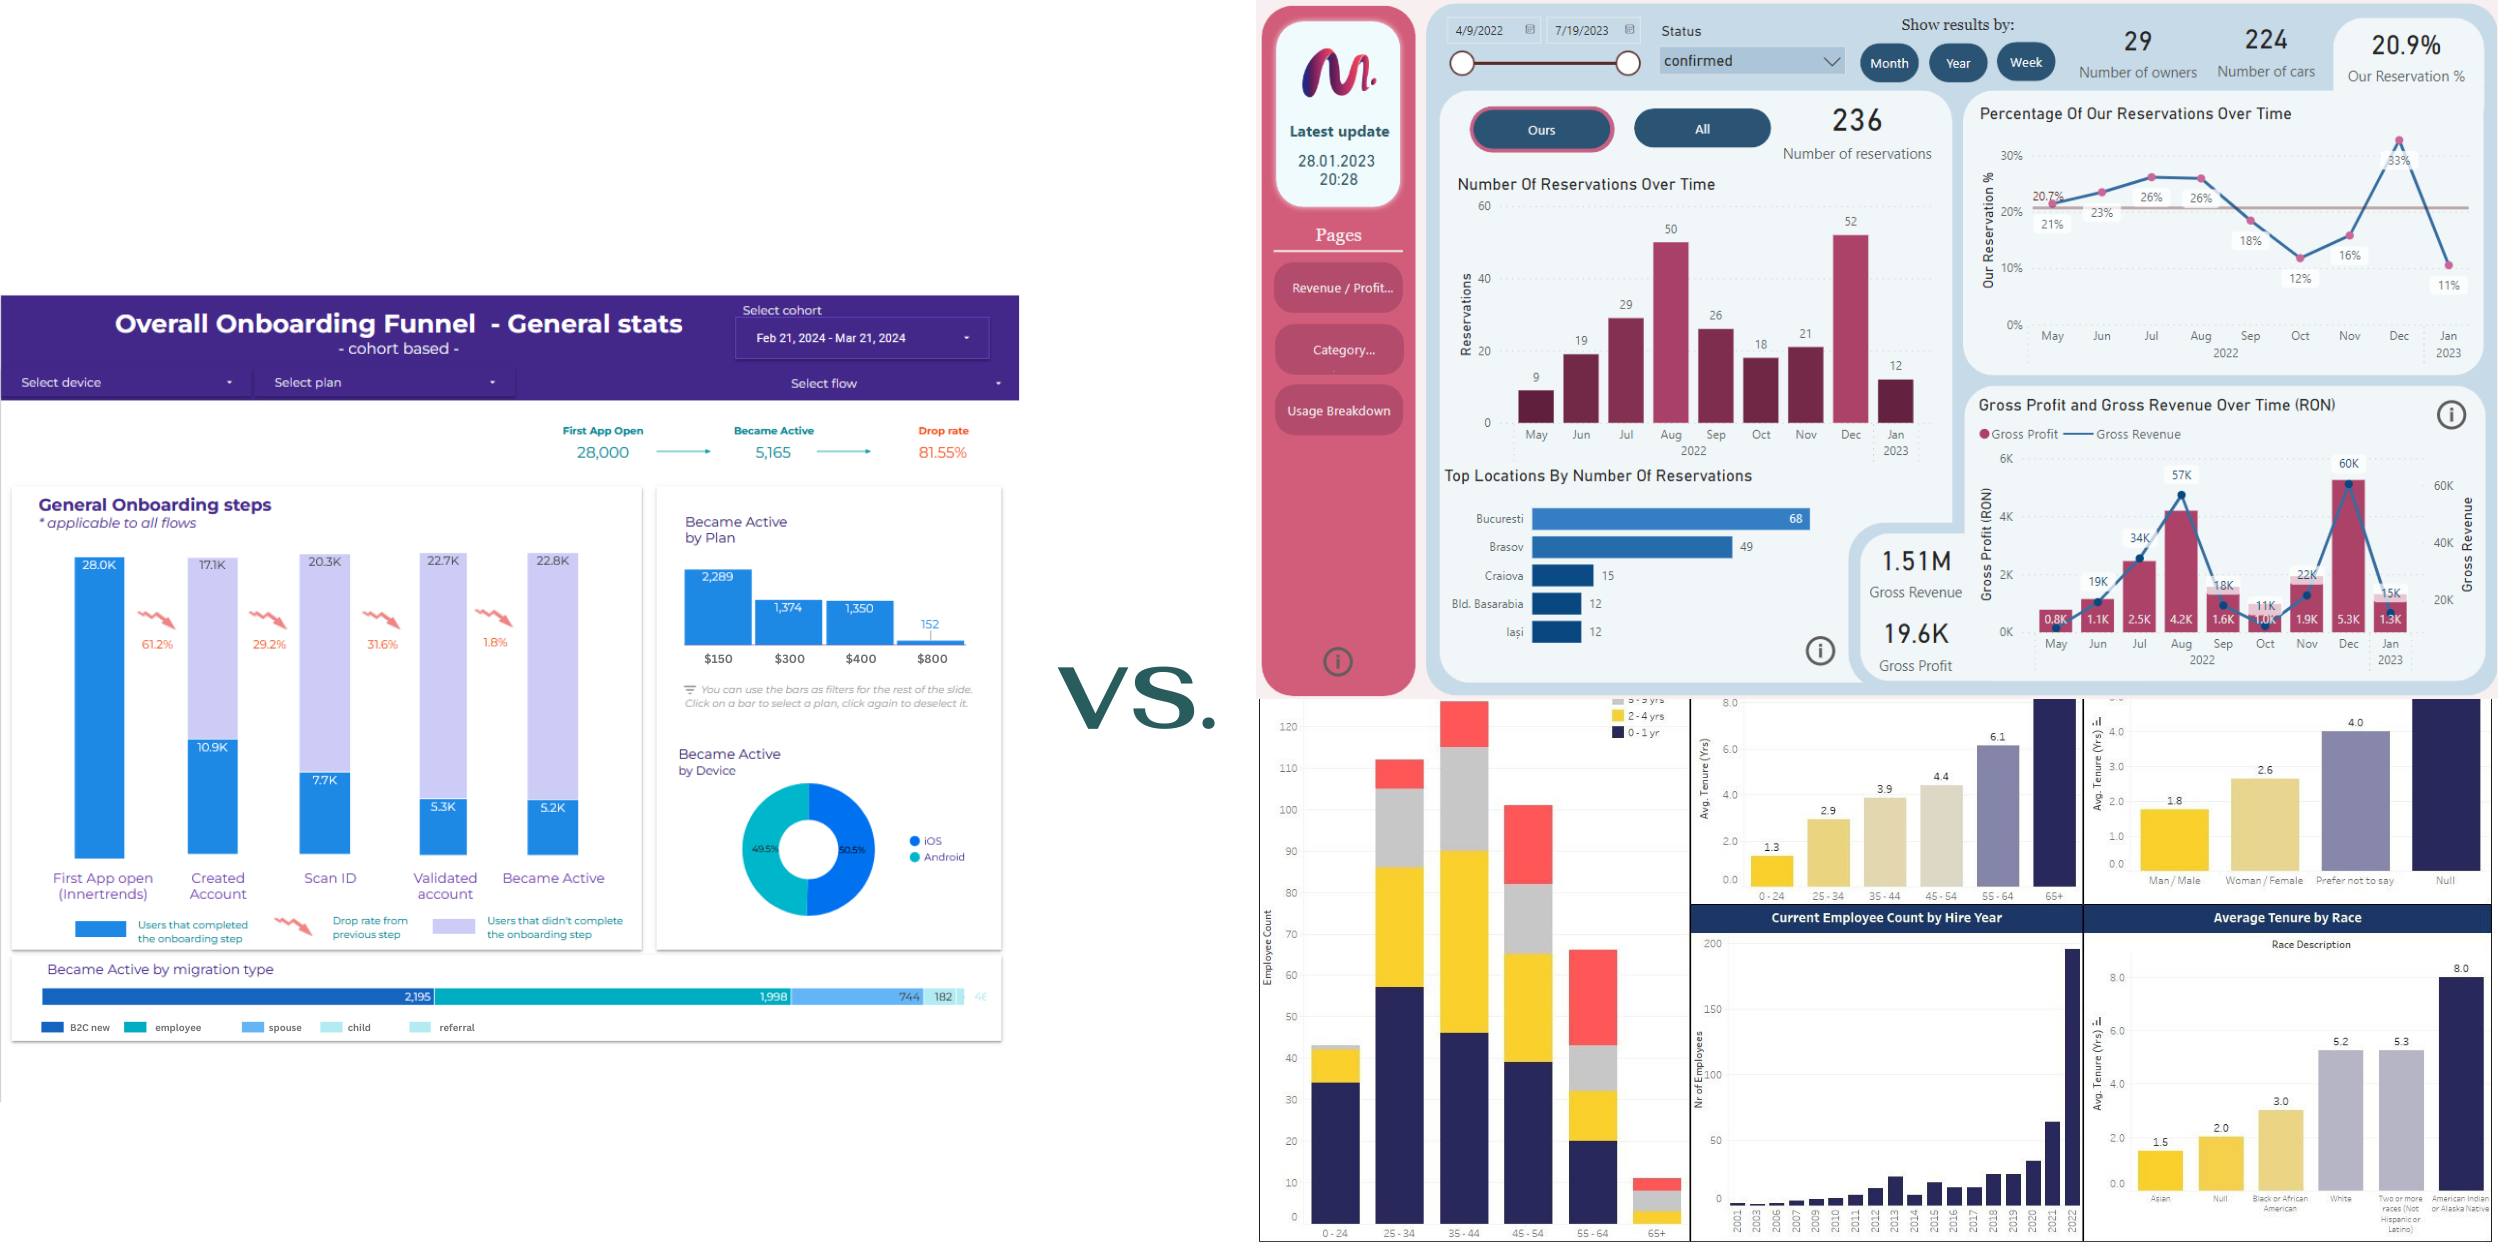
Interactive dashboards are another advantage, allowing users to explore data in greater depth through drill-downs and filters. For example, a PowerBI dashboard could allow a user to start at a company-wide sales overview and drill down to individual salesperson performance, something not feasible with Looker Studio's more basic interactivity.
Advanced Analytics Capabilities and Real-Time Data Handling
Both PowerBI and Tableau offer advanced analytics capabilities, such as predictive modeling, statistical analysis, and machine learning, making it possible to unearth hidden insights from data. In contrast, Looker Studio's analytics features are more basic.
Take, for example, cohort analysis, an advanced analytical tool. Tableau's versatility allows for on-the-fly cohort analysis with just a few clicks, while PowerBI uses DAX to create similar cohorts. Looker Studio, however, lacks this functionality. Furthermore, PowerBI and Tableau stand out when it comes to analyzing dynamic and flexible user cohorts.
In PowerBI, the direct query feature enables data analysts to interactively adjust and filter data without the need to import the entire data set. This feature is incredibly valuable when dealing with larger data sets, as it enhances the responsiveness and flexibility of the data analysis. You can filter and manipulate data on the fly, making it easy to dynamically adjust user cohorts based on interactions with a filter.
Similarly, Tableau offers custom live SQL connections with parameters. This feature enables you to set up dynamic data sources where the data returned can change based on user interactions with the dashboard. It's a powerful way to create interactive, flexible user cohorts that respond to filter changes in real-time.
In contrast, Looker Studio does not offer similar functionalities for real-time, interactive cohort analysis. This limitation restricts the flexibility and dynamism of user cohort analysis in Looker Studio, making it a less optimal choice for businesses that require more sophisticated analytical capabilities.
Real-time data handling is another strength of PowerBI and Tableau. These tools can process real-time data feeds, enabling businesses to monitor their data in real-time and respond to changes promptly. This is especially beneficial for sectors like finance or healthcare, where real-time monitoring is critical. Looker Studio, however, lacks real-time data feed support.
Data Transformation and Cleansing
PowerBI and Tableau also excel in data transformation and cleansing, providing users with advanced functions such as DAX formulas (PowerBI) and LOD calculations (Tableau). These allow users to have greater control over calculated fields, influencing how they interact with other charts and filters. In Looker Studio, such advanced data manipulation isn't possible.
These tools also offer more flexible options for complex ETL processes and can integrate with numerous data sources, including cloud-based platforms like AWS and Google Cloud Platform. This flexibility facilitates effortless data
access and manipulation, irrespective of the storage location. For example, PowerBI's Power Query Editor provides an intuitive, GUI-based interface for cleaning and transforming data without needing to write a line of code. This is something that Looker Studio's data preparation tools can't match in either power or flexibility.
Advanced Security Features
Lastly, when it comes to security features, PowerBI and Tableau offer more advanced options than Looker Studio. Features like role-based access control and data governance ensure that sensitive information is accessible only to authorized personnel. This is critical for larger organizations that need to comply with industry regulations or protect confidential data. For instance, PowerBI's row-level security allows you to control access to data based on user roles, ensuring that users only see data relevant to their role.
Embedded Analytics
Looker Studio does offer an embedding feature, allowing users to share dashboards and reports by embedding them in other web pages. This is done by generating an embed URL of a report and then using this URL within an 'iframe' tag in the web page's HTML code. While this feature does provide some level of external sharing and integration, it's important to note that it comes with some limitations.
For instance, the interactivity of embedded Looker Studio reports is somewhat limited compared to that of the native application. Certain features, like exporting data or report-level comments, are not available when a report is embedded.
Additionally, Looker Studio's embedding feature does not offer the same level of customization and control as the embedding features of PowerBI and Tableau. PowerBI, for example, has a robust JavaScript SDK that allows developers to not only embed reports, but also interact with and control embedded reports using JavaScript. This allows for a highly customizable and interactive embedded BI experience.
Tableau, on the other hand, also offers a JavaScript API for embedding visualizations into web applications. This API provides a high degree of flexibility and control, enabling developers to customize the Tableau user interface, interact with the embedded visualization programmatically, and dynamically change the data being visualized.
Therefore, while Looker Studio does offer embedding capabilities, they are not as robust, flexible, or interactive as those provided by PowerBI and Tableau. This can limit the integration of Looker Studio reports into broader business applications and workflows, making PowerBI and Tableau a more powerful choice for businesses that require extensive embedding and integration capabilities.
Training and Support
Both PowerBI and Tableau offer extensive resources for user training, including online tutorials, webinars, and user communities where professionals share knowledge and help each other troubleshoot issues. This can significantly ease the transition to a new platform, boost productivity, and help users maximize the potential of the tool.
Advanced AI Capabilities
PowerBI and Tableau have started integrating AI capabilities into their platforms, allowing for more advanced predictive analytics. These AI features can help businesses anticipate future trends, understand potential outcomes, and make more informed, data-driven decisions.
Customization and Branding
PowerBI and Tableau offer robust customization options, allowing businesses to design dashboards and reports that align with their branding and meet their unique needs. This level of customization extends to the control of data visualizations, report layout, and interactivity, which can significantly enhance the user experience.
Price
While it's true that Looker/Google Data Studio is a free tool, it's worth noting that the transition to more powerful platforms like PowerBI and Tableau does not necessarily imply a prohibitive cost. These platforms have priced their offerings competitively, ensuring that businesses seeking to elevate their data analysis and visualization capabilities can do so without breaking the bank.
PowerBI, in particular, is known for its cost-effectiveness. As of 2023, the PowerBI Pro version is priced at just $10 per user per month. This makes it a highly accessible option for small to medium-sized businesses ready to take their data analytics to the next level. In fact, given the significant boost in analytical capabilities and the potential for business impact, many companies find that the return on investment for adopting PowerBI is quickly realized.
On the other hand, Tableau, while priced higher than PowerBI, still represents a viable option for businesses seeking advanced data visualization and analytical capabilities. The Tableau Creator subscription, which offers a full range of data preparation, analytics, and visualization capabilities, is priced at $70 per user per month as of 2023. It's worth noting that Tableau also offers lower-cost subscriptions for users who need to view and interact with data, but not necessarily create new visualizations, further reducing the overall cost for businesses.
When considering these costs, it's important to factor in the enhanced capabilities these platforms offer over Data Studio, such as handling complex data sets, creating custom reports, offering advanced analytics capabilities, and providing robust data transformation and cleansing options. The transition to PowerBI or Tableau from Looker Studio, therefore, is not just about a cost consideration, but also about the value that these more powerful tools can bring to your organization's data analysis and decision-making processes.
Conclusion
While Looker/Google Data Studio is a powerful and easy-to-use tool for basic data visualization and analysis, it may not be the best option for companies requiring more sophisticated analytics and data management capabilities. BI tools like PowerBI and Tableau offer a broader range of features and capabilities that can help organizations gain valuable insights from their data and make informed, data-driven decisions. Whether it's creating advanced data visualizations, blending data from multiple sources, performing complex data transformations, or implementing advanced security features, PowerBI and Tableau provide a level of functionality that Looker Studio can't match.
*Note of Independence and Objectivity *
At Witanalytica, we take great pride in our commitment to unbiased, objective analysis. We firmly believe that our independence is key to our credibility and the trust we build with our clients. It's important to clarify that we are not affiliated with, partnered with, nor are we financially compensated by any data analytics tool providers.
Our content, including this article, is entirely unsponsored. This is a deliberate choice to ensure our unwavering objectivity in recommending the most suitable tools for our customers. We stand by our commitment to providing honest, unbiased advice based on our professional expertise and deep understanding of the data analytics landscape.