Challenge:
Tracking income from multiple affiliate networks is hard because each platform reports revenue, conversions, and costs differently.
The only reliable way to track real affiliate income across networks is to centralize all data into a single reporting layer, normalize publishers and offers, and calculate profitability using the same logic everywhere.
Below is the exact framework we use to do this at scale for a US e-commerce customer running an affiliate program.
Solution
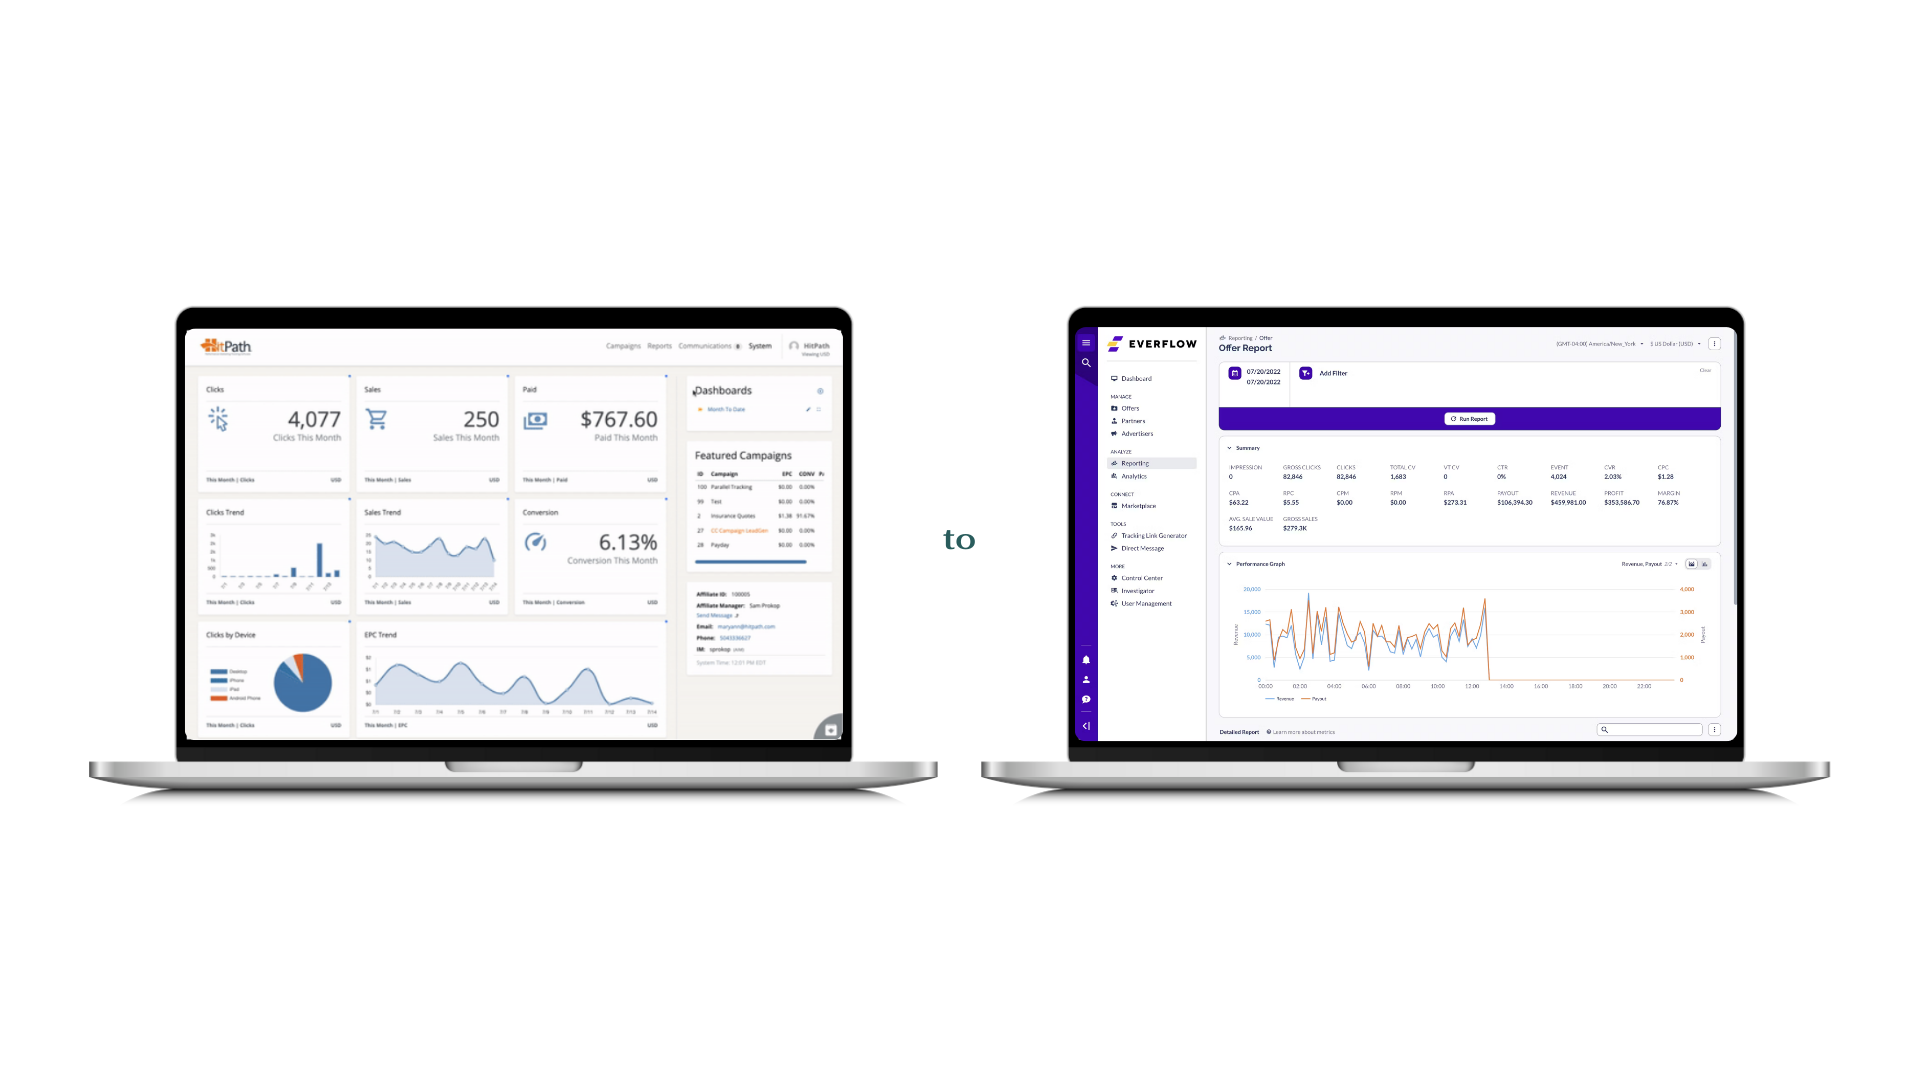
To simplify the affiliate program’s management and performance monitoring, we developed a centralized reporting solution. The goal was to bring all program data, spanning platforms like Everflow, Shopify, Salesforce, Rakuten, and others into a single, real-time dashboard. Instead of juggling multiple platforms and manually updating spreadsheets, affiliate managers now have a unified view of the entire program, refreshed automatically with the latest data.
This solution allows them to easily track ROAS (Return on Ad Spend), affiliate and offer performance, and trends across networks, without spending hours on manual reporting. Additionally, it includes features to identify profitability opportunities, helping managers focus on strategy and optimization rather than data gathering. By automating and consolidating performance metrics, we’ve equipped the team with the tools to take immediate action to address underperformance or scaling up successful campaigns.
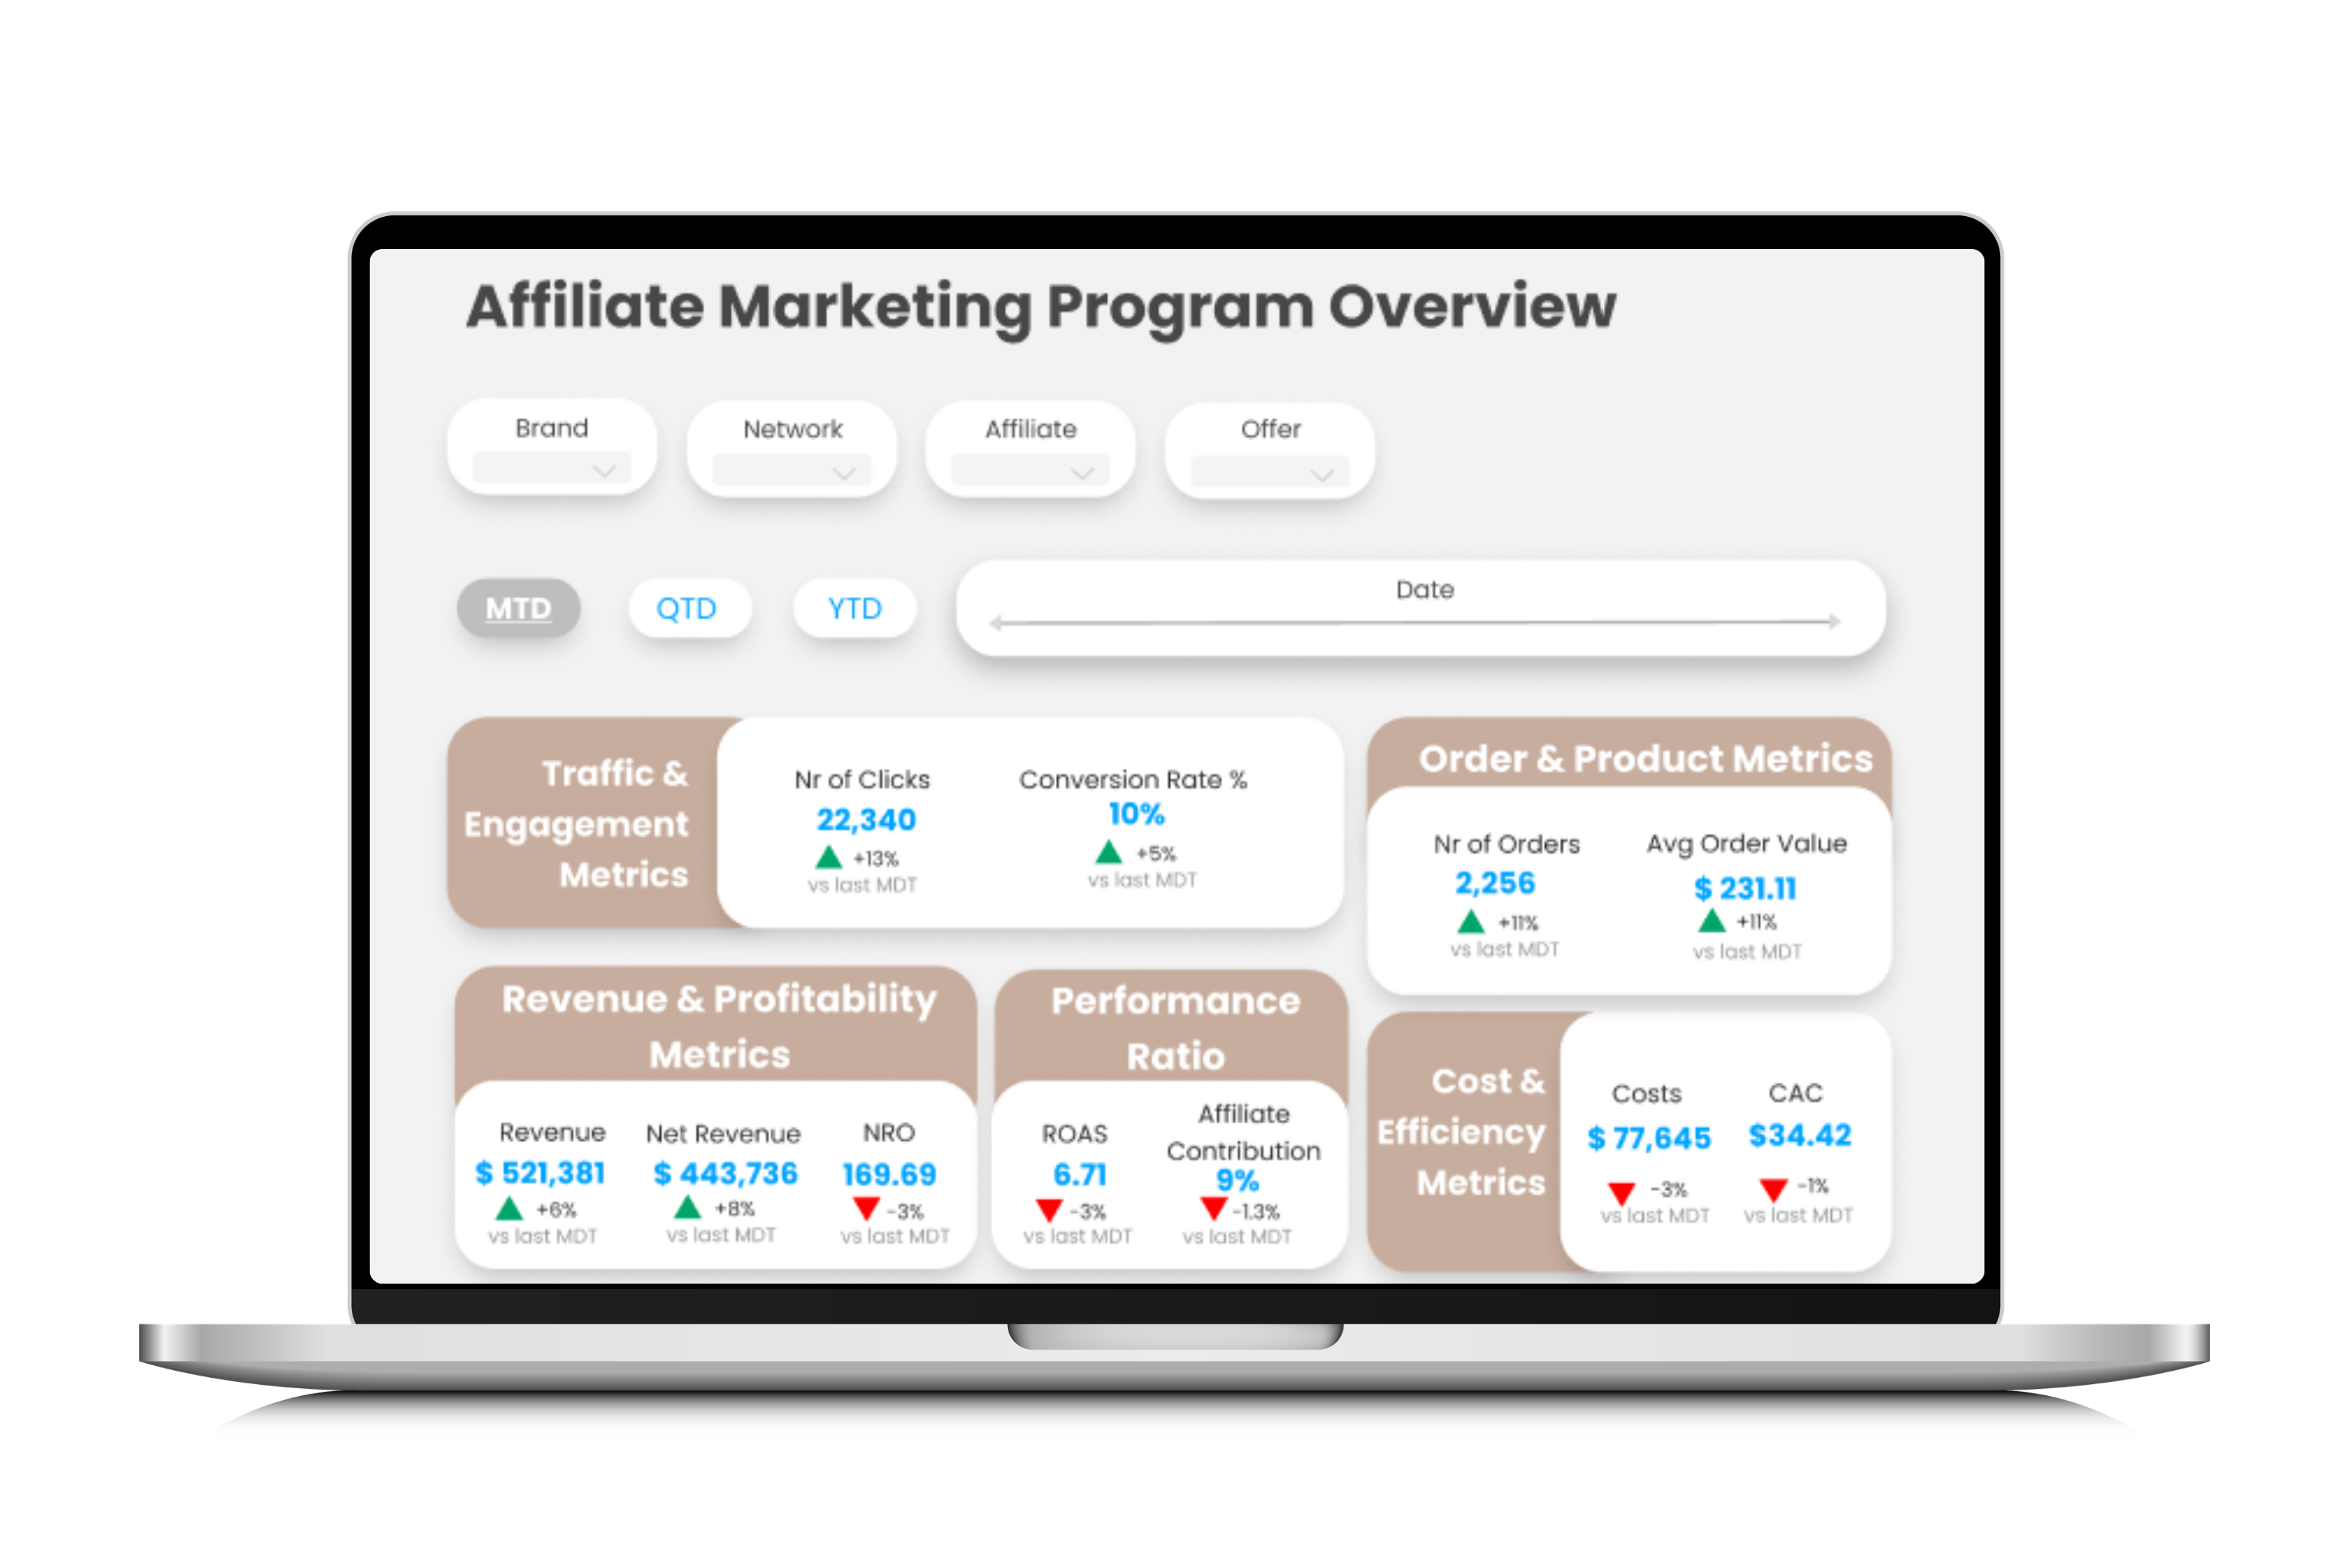
The above charts unified performance data from multiple networks and brands, enabling the customer to track revenue, conversions, ROAS, and costs in real time. It streamlined multi-brand management, highlighted key trends, and identified inefficiencies, saving hours of manual reporting and providing actionable insights to optimize their affiliate program effectively.
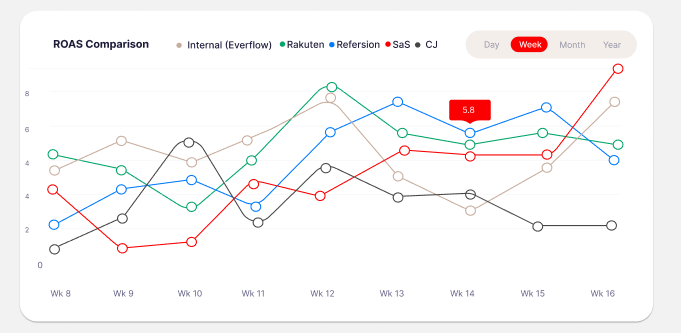
The ROAS comparison by network graph helps affiliate managers identify which networks or direct publishers are underperforming in terms of ROAS. For networks with declining ROAS, they can renegotiate commissions, cap spending, or reallocate budgets to better-performing networks or publishers, ensuring resources are directed where they deliver the highest returns.
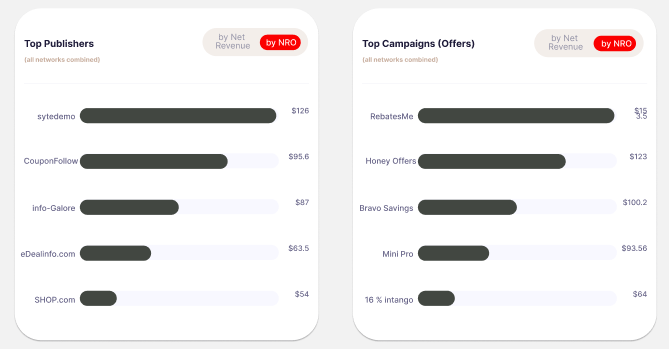
This chart on the left helps track the aggregated performance of a publisher across multiple networks, offering a unified view of their contributions to the program. Meanwhile, the chart on the right allows an affiliate manager to evaluate the contribution of campaigns, regardless of the number of platforms they're listed on, simplifying performance comparisons.
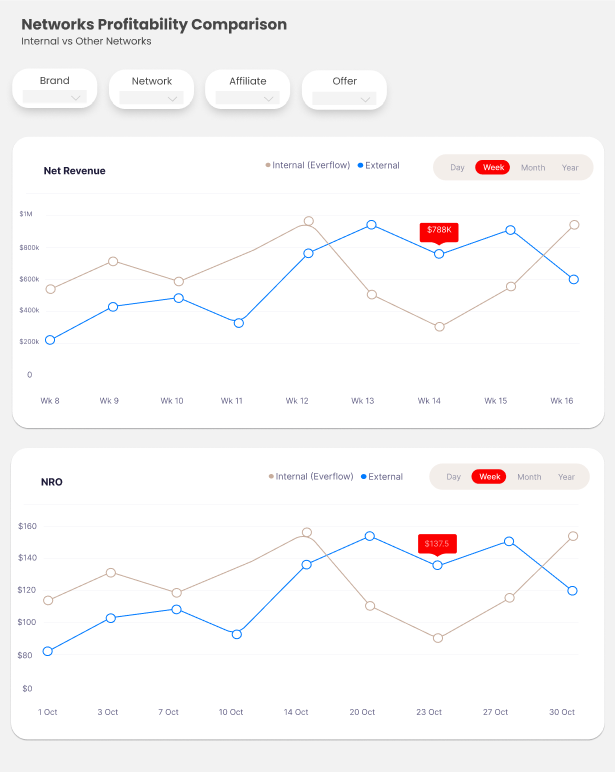
These charts provide a clear comparison of profitability between managing affiliates directly and relying on external networks. By incorporating all direct costs, such as Everflow subscription fees, data analytics infrastructure, and an additional affiliate manager assistant expenses, this visualization offers a realistic and fair assessment of the financial trade-offs. It allows the affiliate program managers to determine whether the additional effort and investment required for direct management result in higher profitability or whether external networks remain a more cost-effective solution.
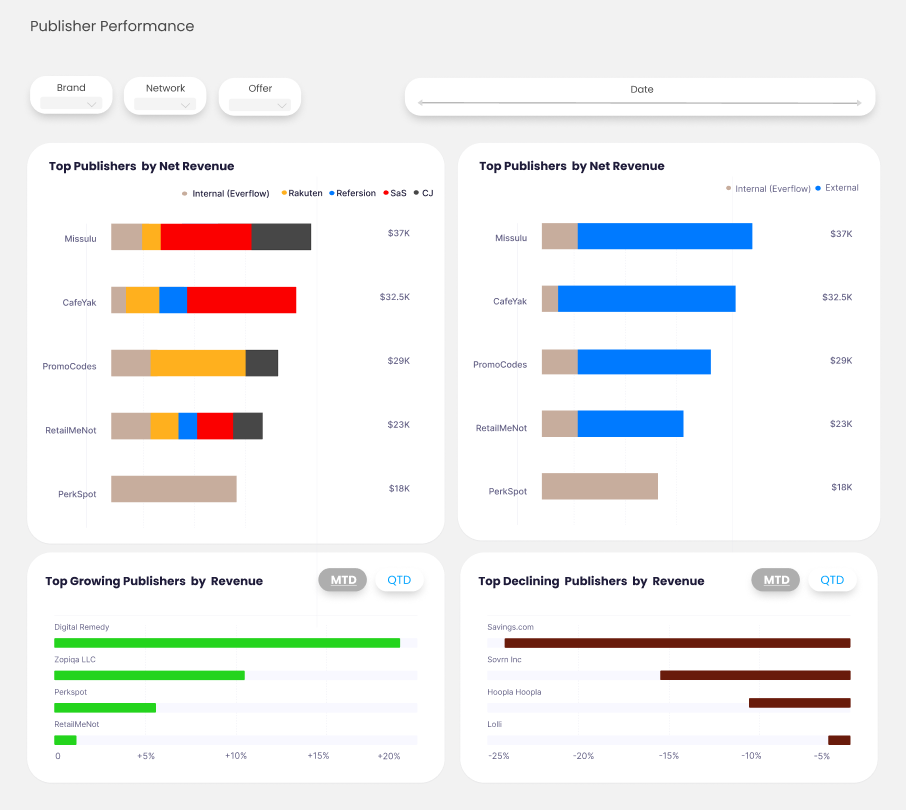
This dashboard is valuable for affiliate managers dealing with publishers active across multiple networks. By aggregating all performance data for a publisher from various networks, it provides a unified view of their contributions. This eliminates redundancy and ensures accurate performance comparisons, enabling managers to better identify top performers, analyze growth trends, and address underperforming affiliates. It saves time and provides clarity that wouldn’t be possible by analyzing network-specific reports in isolation.
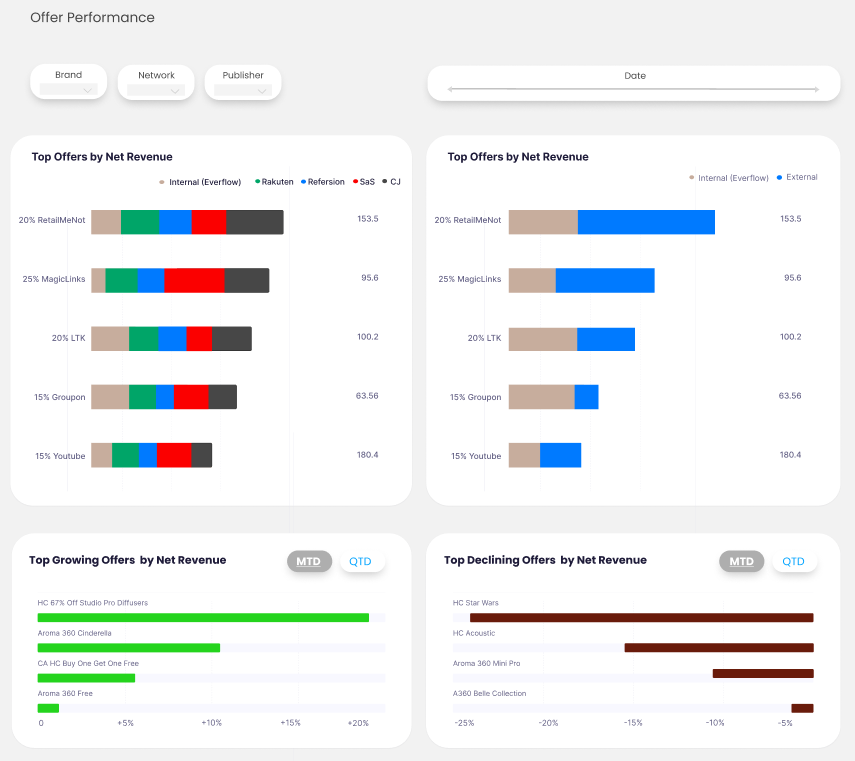
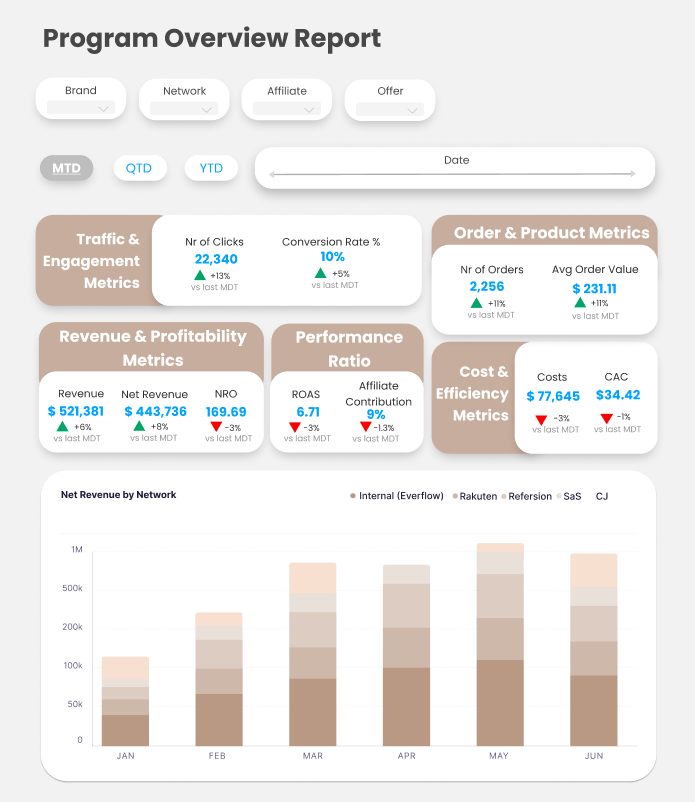
This dashboard applies the same aggregation principle but focuses on offers rather than publishers. It combines performance data for specific offers across all networks, providing a clear view of how each offer contributes to net revenue. This enables affiliate managers to identify top-performing offers, analyze growth trends, and address declining performance more effectively. It eliminates the guesswork involved in piecing together offer performance from multiple platforms, saving time and enabling targeted optimizations.
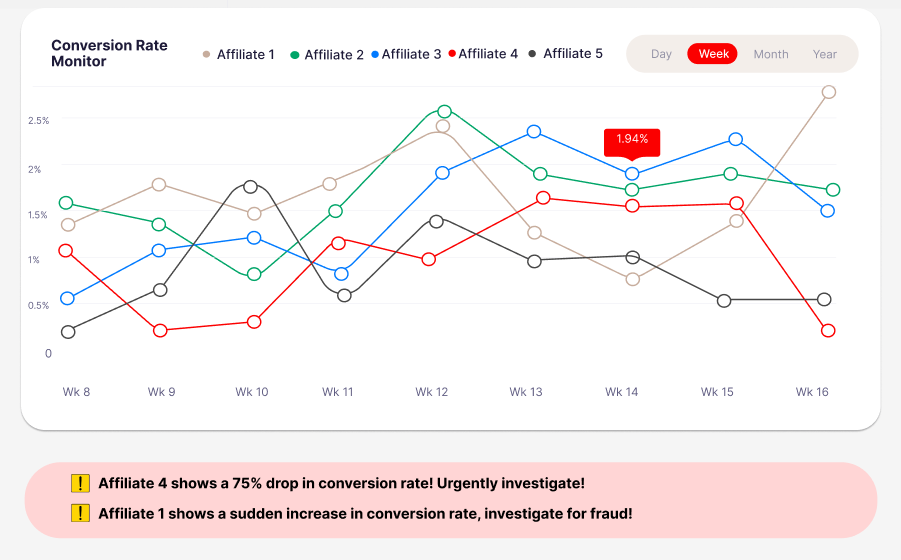
We’ve equipped the dashboards with advanced monitoring alerts to flag significant variations and outliers in conversion rates for both affiliates and offers. Alerts like these enable managers to identify potential issues such as fraud (sudden spikes) or operational challenges (steep declines), ensuring swift action to protect profitability and program integrity. Some alerts are sent by email as they happen or on a regular basis (daily, weekly)
Results
The data warehouse has empowered the affiliate program management team with a comprehensive tool to monitor performance and spending across all platforms. It provides a unified view of the program’s effectiveness, enabling comparisons between working with networks and directly managing publishers. This foundation not only streamlines decision-making but also opens the door to more advanced AI implementations.
The next step for us is to deploy AI agents that identify mismatches in performance and profitability. These agents will recommend commission renegotiations or caps, optimizing the effectiveness of the affiliate program and driving higher profitability through data-driven strategies.
Technologies and Tools
Affiliate Networks and Platforms: Rakuten, ShareASale, CJ, Refersion, Everflow
E-Commerce and CRM Platforms: Shopify, Salesforce
Database: Cloud SQL (MySQL)
Serverless Components (GCP): Google Cloud Platform (GCP), Cloud Functions, Cloud Scheduler
Business Intelligence (BI): DOMO dashboards
Programming Language: Python