The client is a leading global snack manufacturer with a diverse portfolio of well-known brands, committed to innovative marketing and distribution strategies across multiple regions.
Challenge:
They struggled to accurately measure the success of their marketing campaigns and required a dashboard that would help them optimize their marketing budget allocations, refine their marketing strategies and improve campaign performance.
Solution
To solve this problem, we created a data analytics framework that integrated marketing and sales data from Amazon. This framework provided a comprehensive view of campaign performance across different brands and regions.
The solution involved several steps:
- Data Integration: Using automated processes, we extracted marketing and sales data from Amazon’s API and loaded it into a centralized cloud database.
- Data Processing: We cleaned and structured the raw data to ensure it was ready for detailed analysis.
- Dashboard Development: We built an interactive dashboard that allowed stakeholders to track campaign performance metrics in real-time. The dashboard offered insights at both summary and detailed levels, including monthly trends and brand-specific performance.
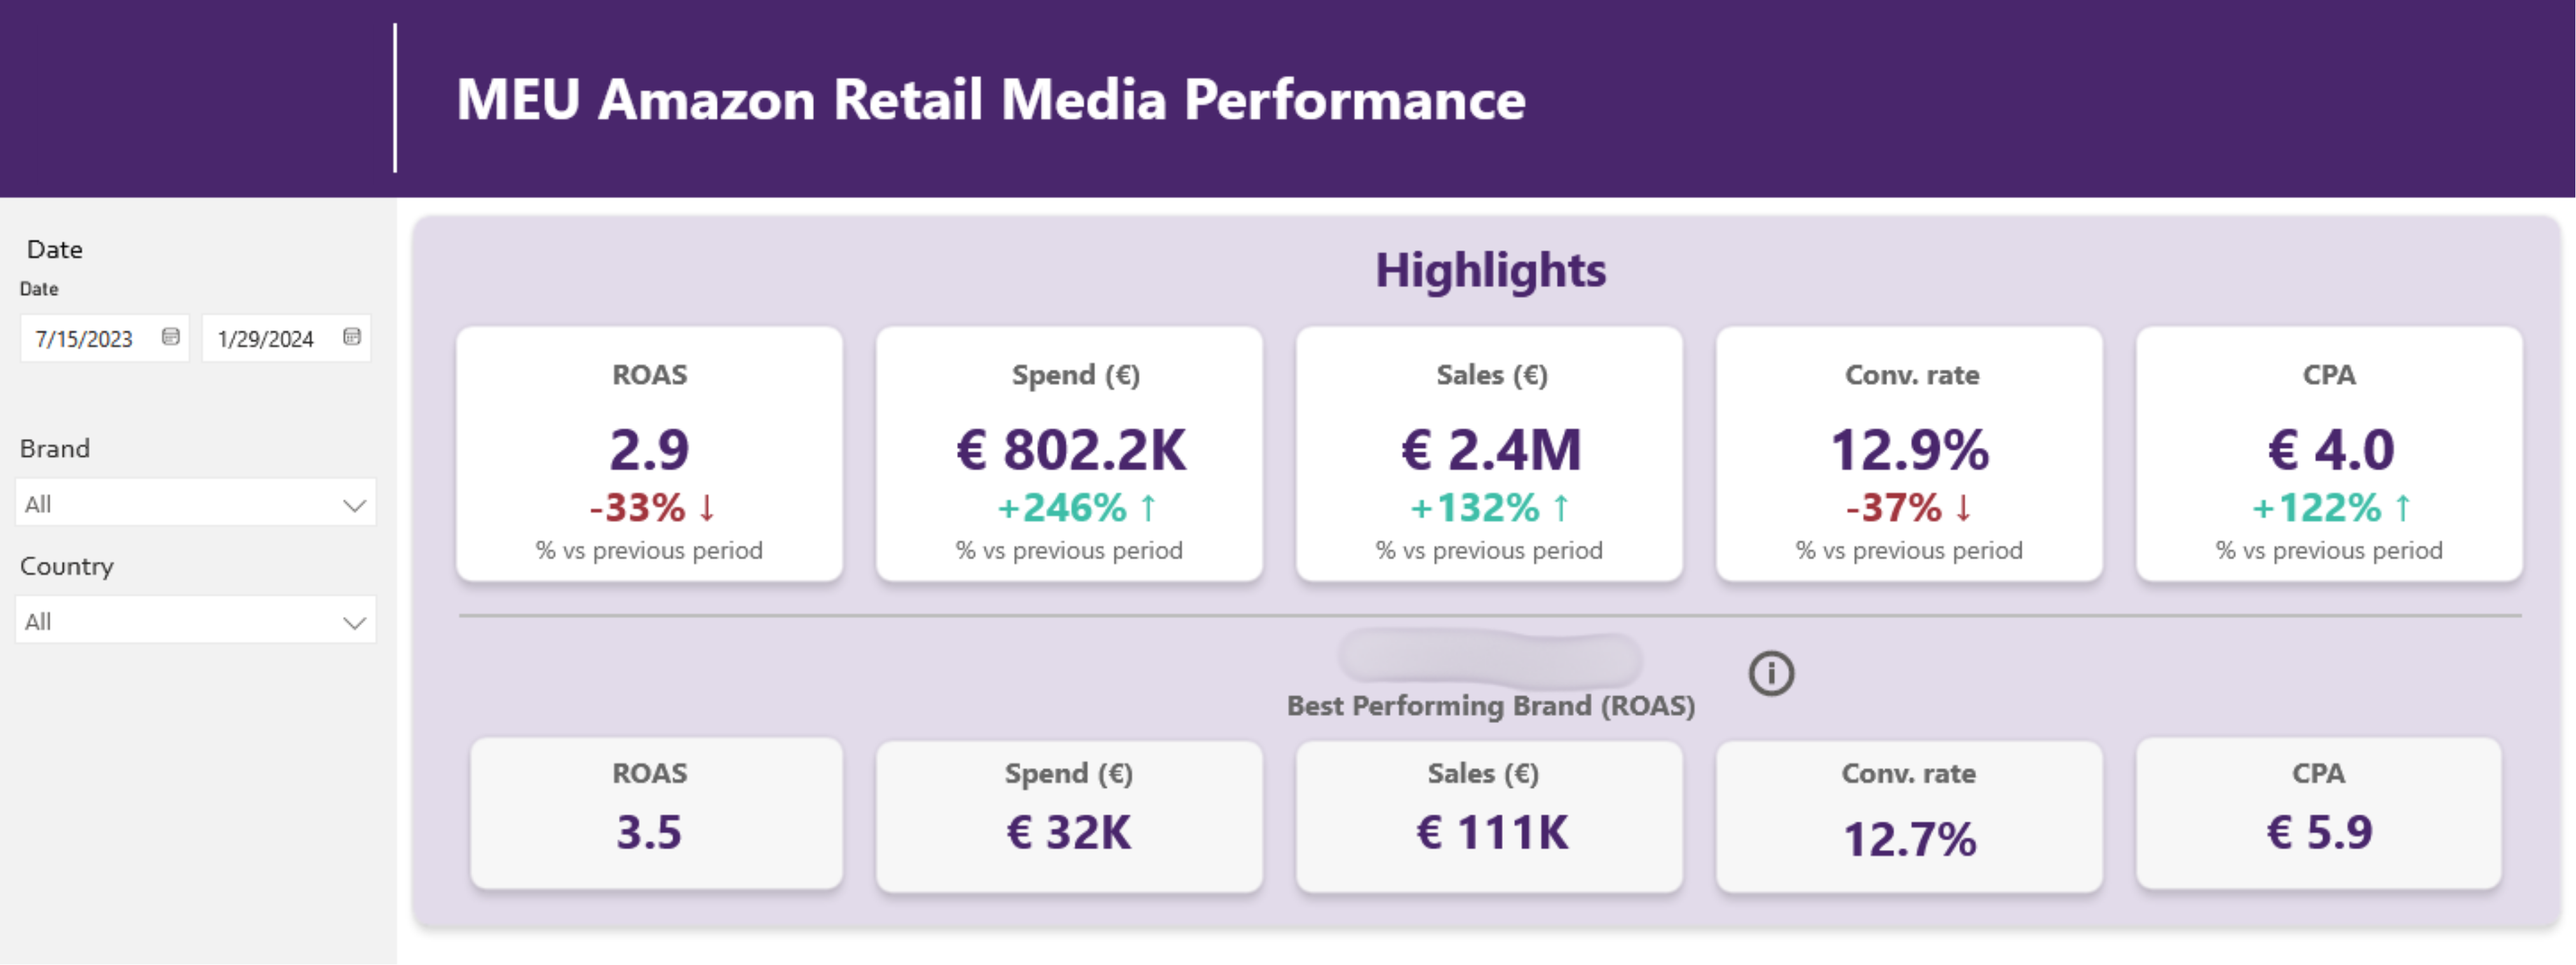
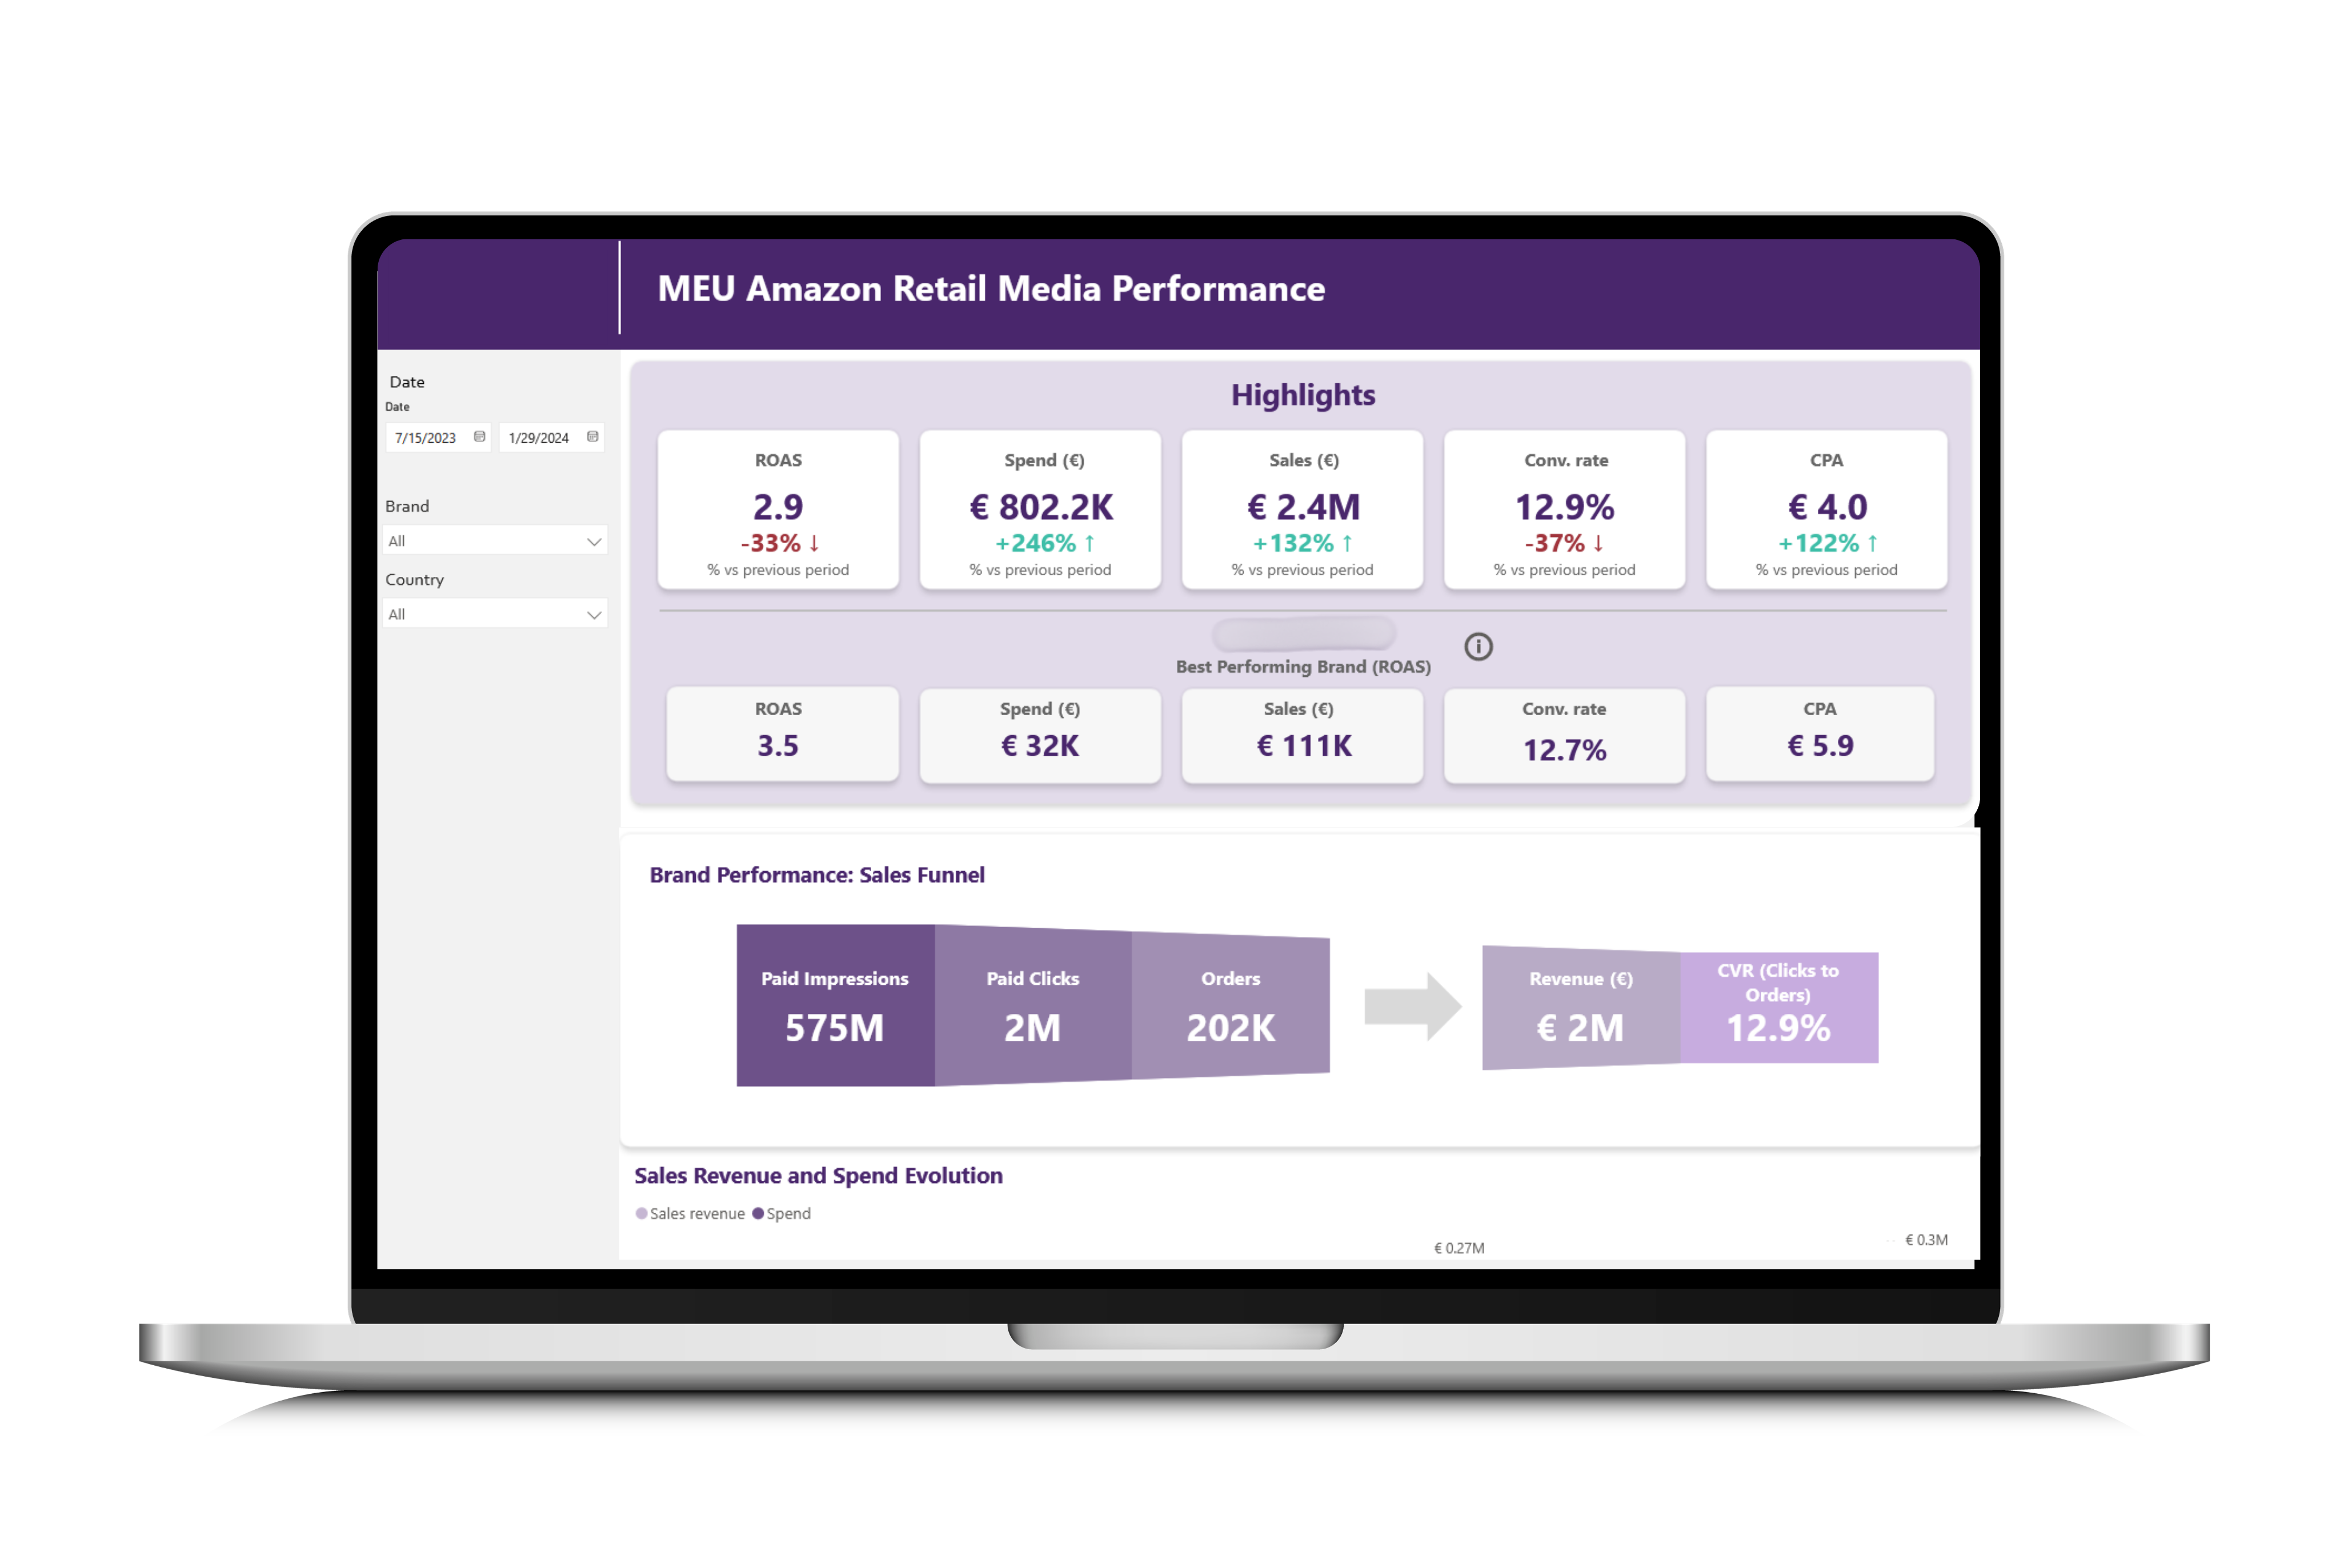
Overview section: Executives can quickly assess the overall performance of paid media campaigns by reviewing key metrics like ROAS, spend, sales, conversion rate, and CPA. Each metric also shows a comparison to the previous period, making it easy to spot any unusual trends.
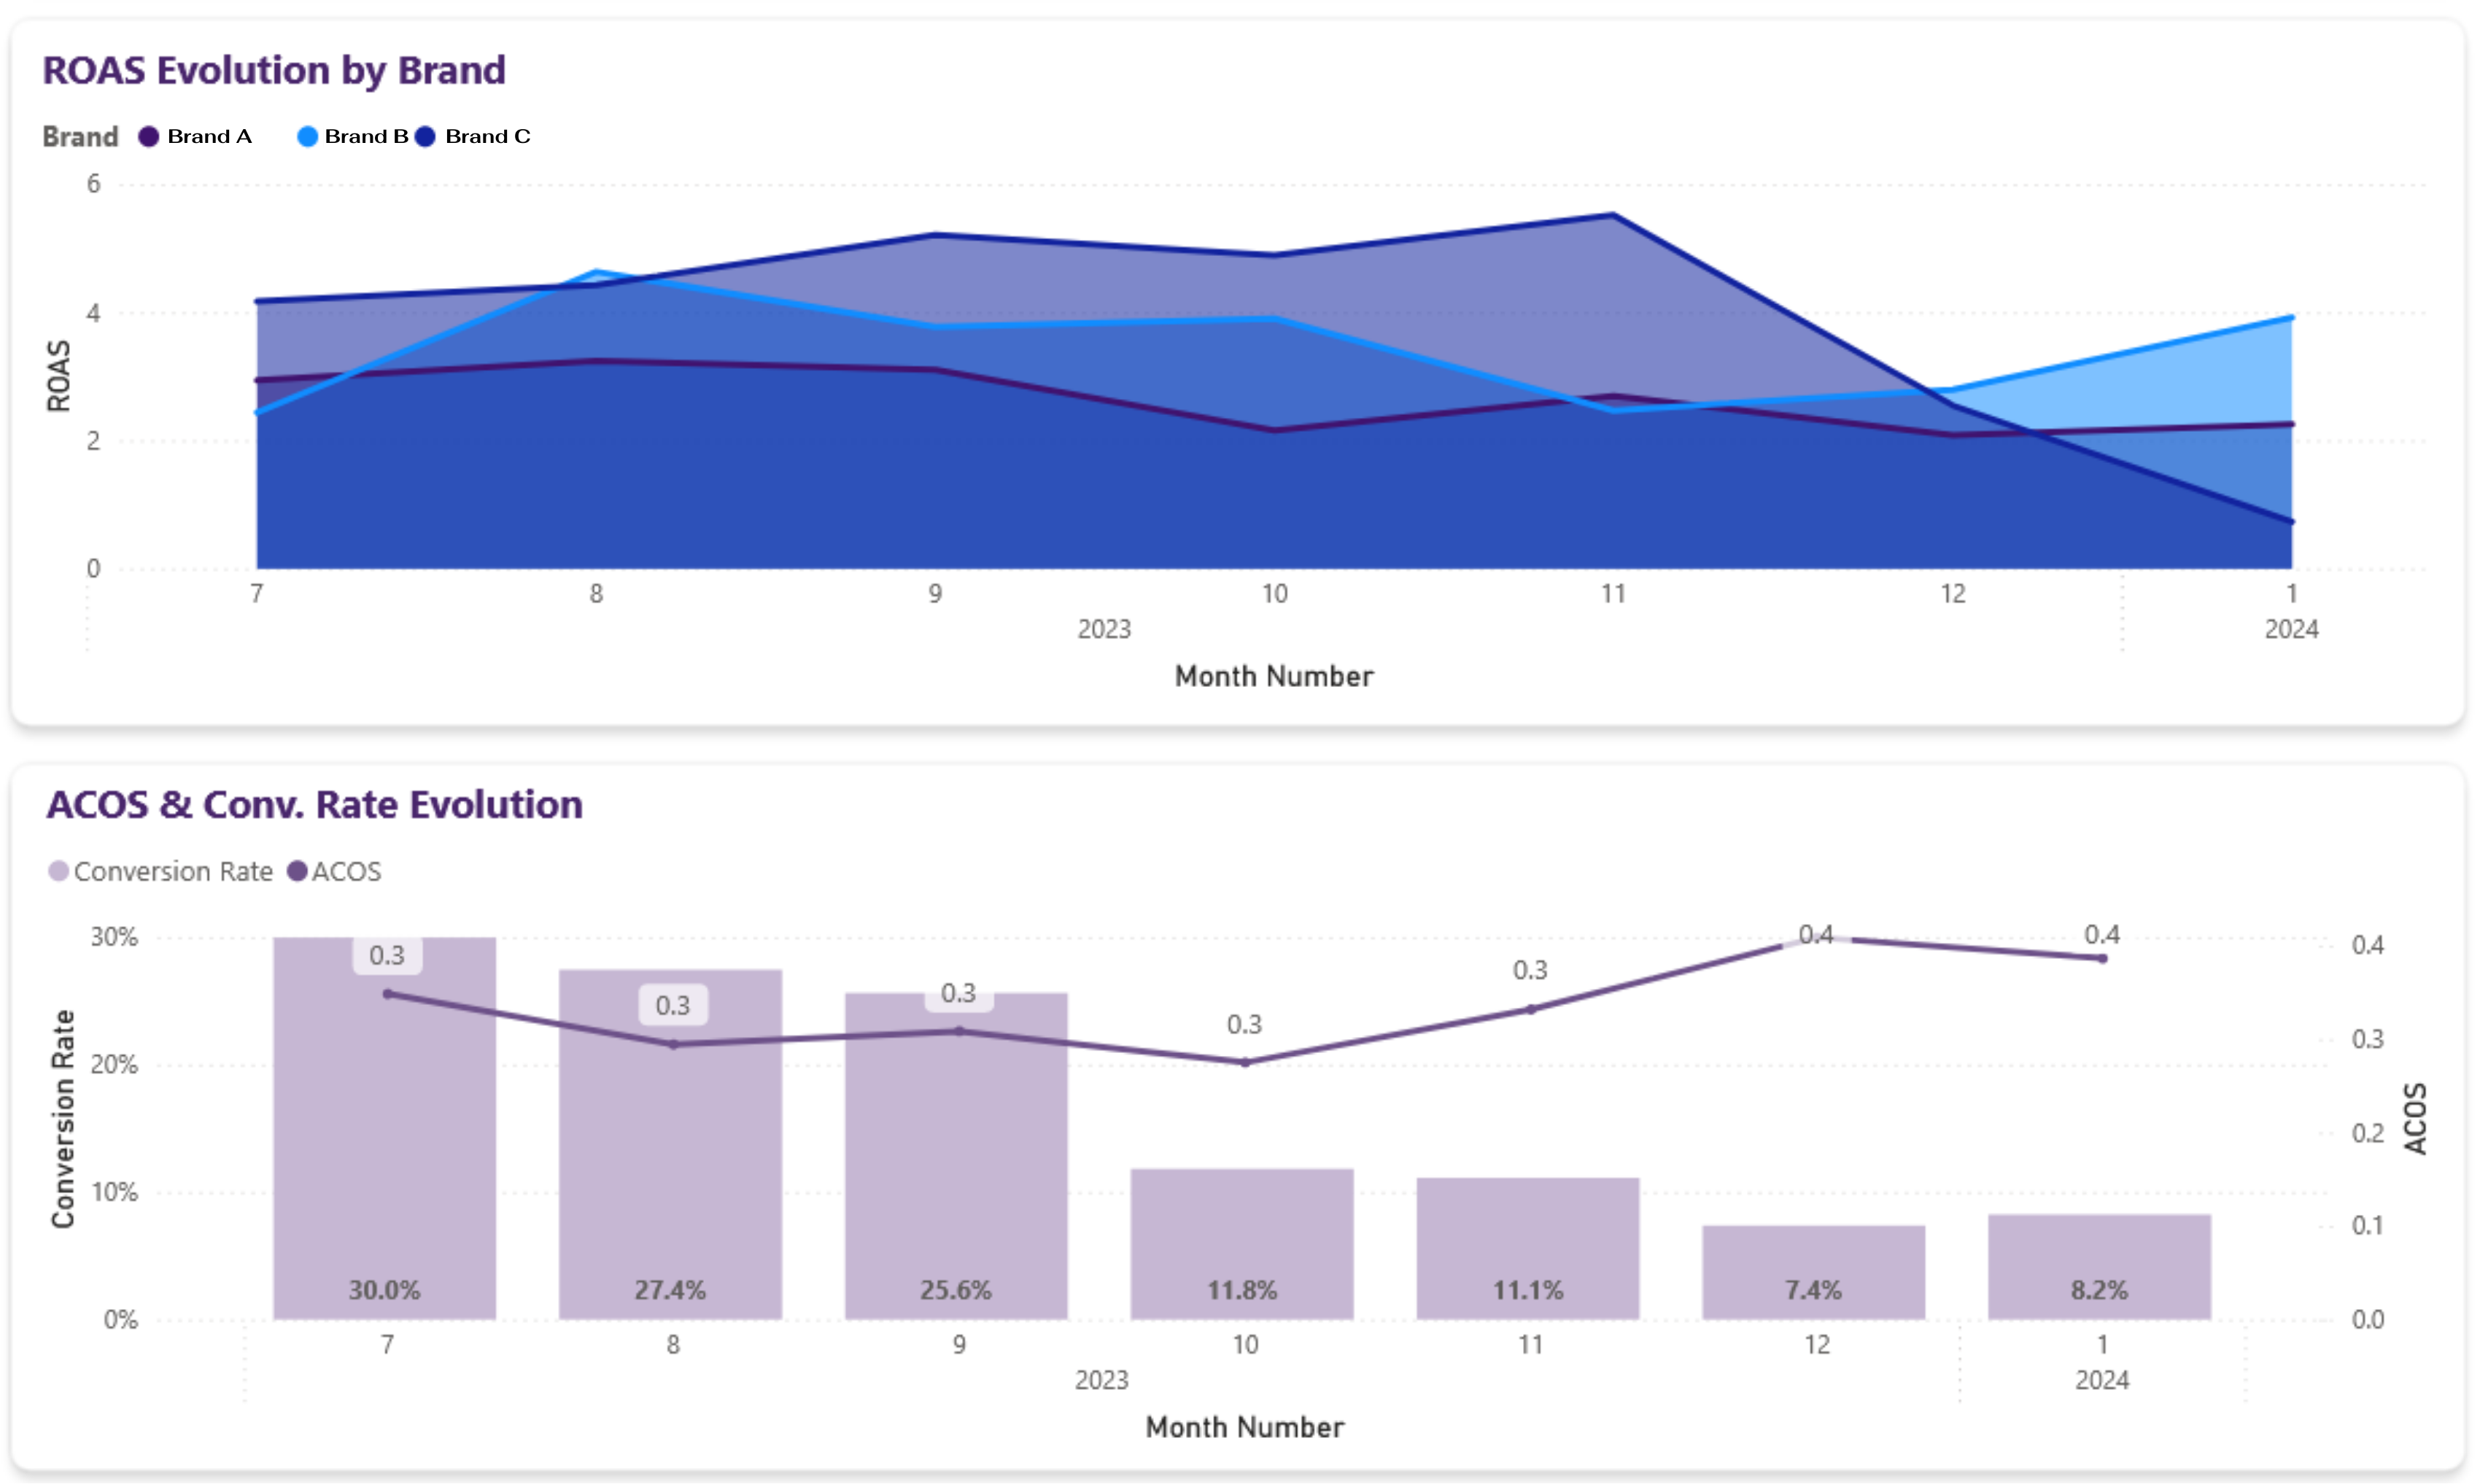
ROAS, ACOS & Conversion Rate Evolution: **Monitoring ROAS by Category is used for pinpointing which brands are driving strong performance and which require strategic adjustments. By analyzing Advertising Cost of Sales (ACOS) and Conversion Rate evolution together, the client gained a detailed understanding of campaign efficiency over time and made strategic adjustments to brands that performed poorly, bringing them in-line with the rest.
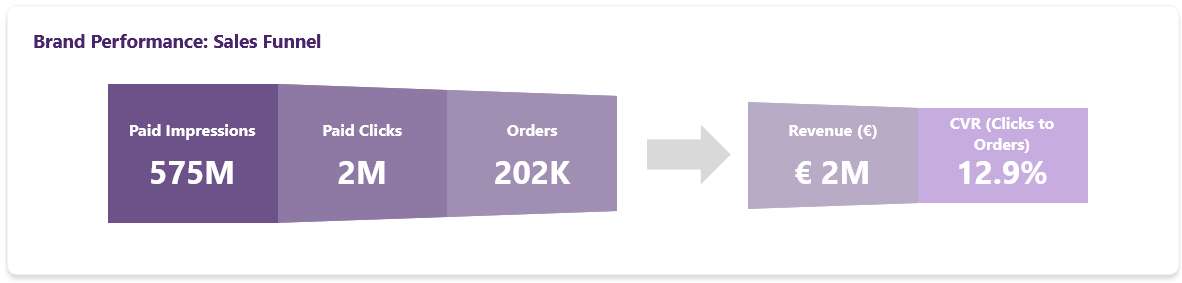
Sales funnel: Provides a detailed overview of the marketing funnel from paid impressions to revenue generation. Executives used this chart to understand the conversion efficiency of their marketing campaigns. By analyzing each stage—from paid impressions, clicks, and orders to revenue and conversion rates (CVR)—they identified where potential drop-offs occur and which step they should focus on.
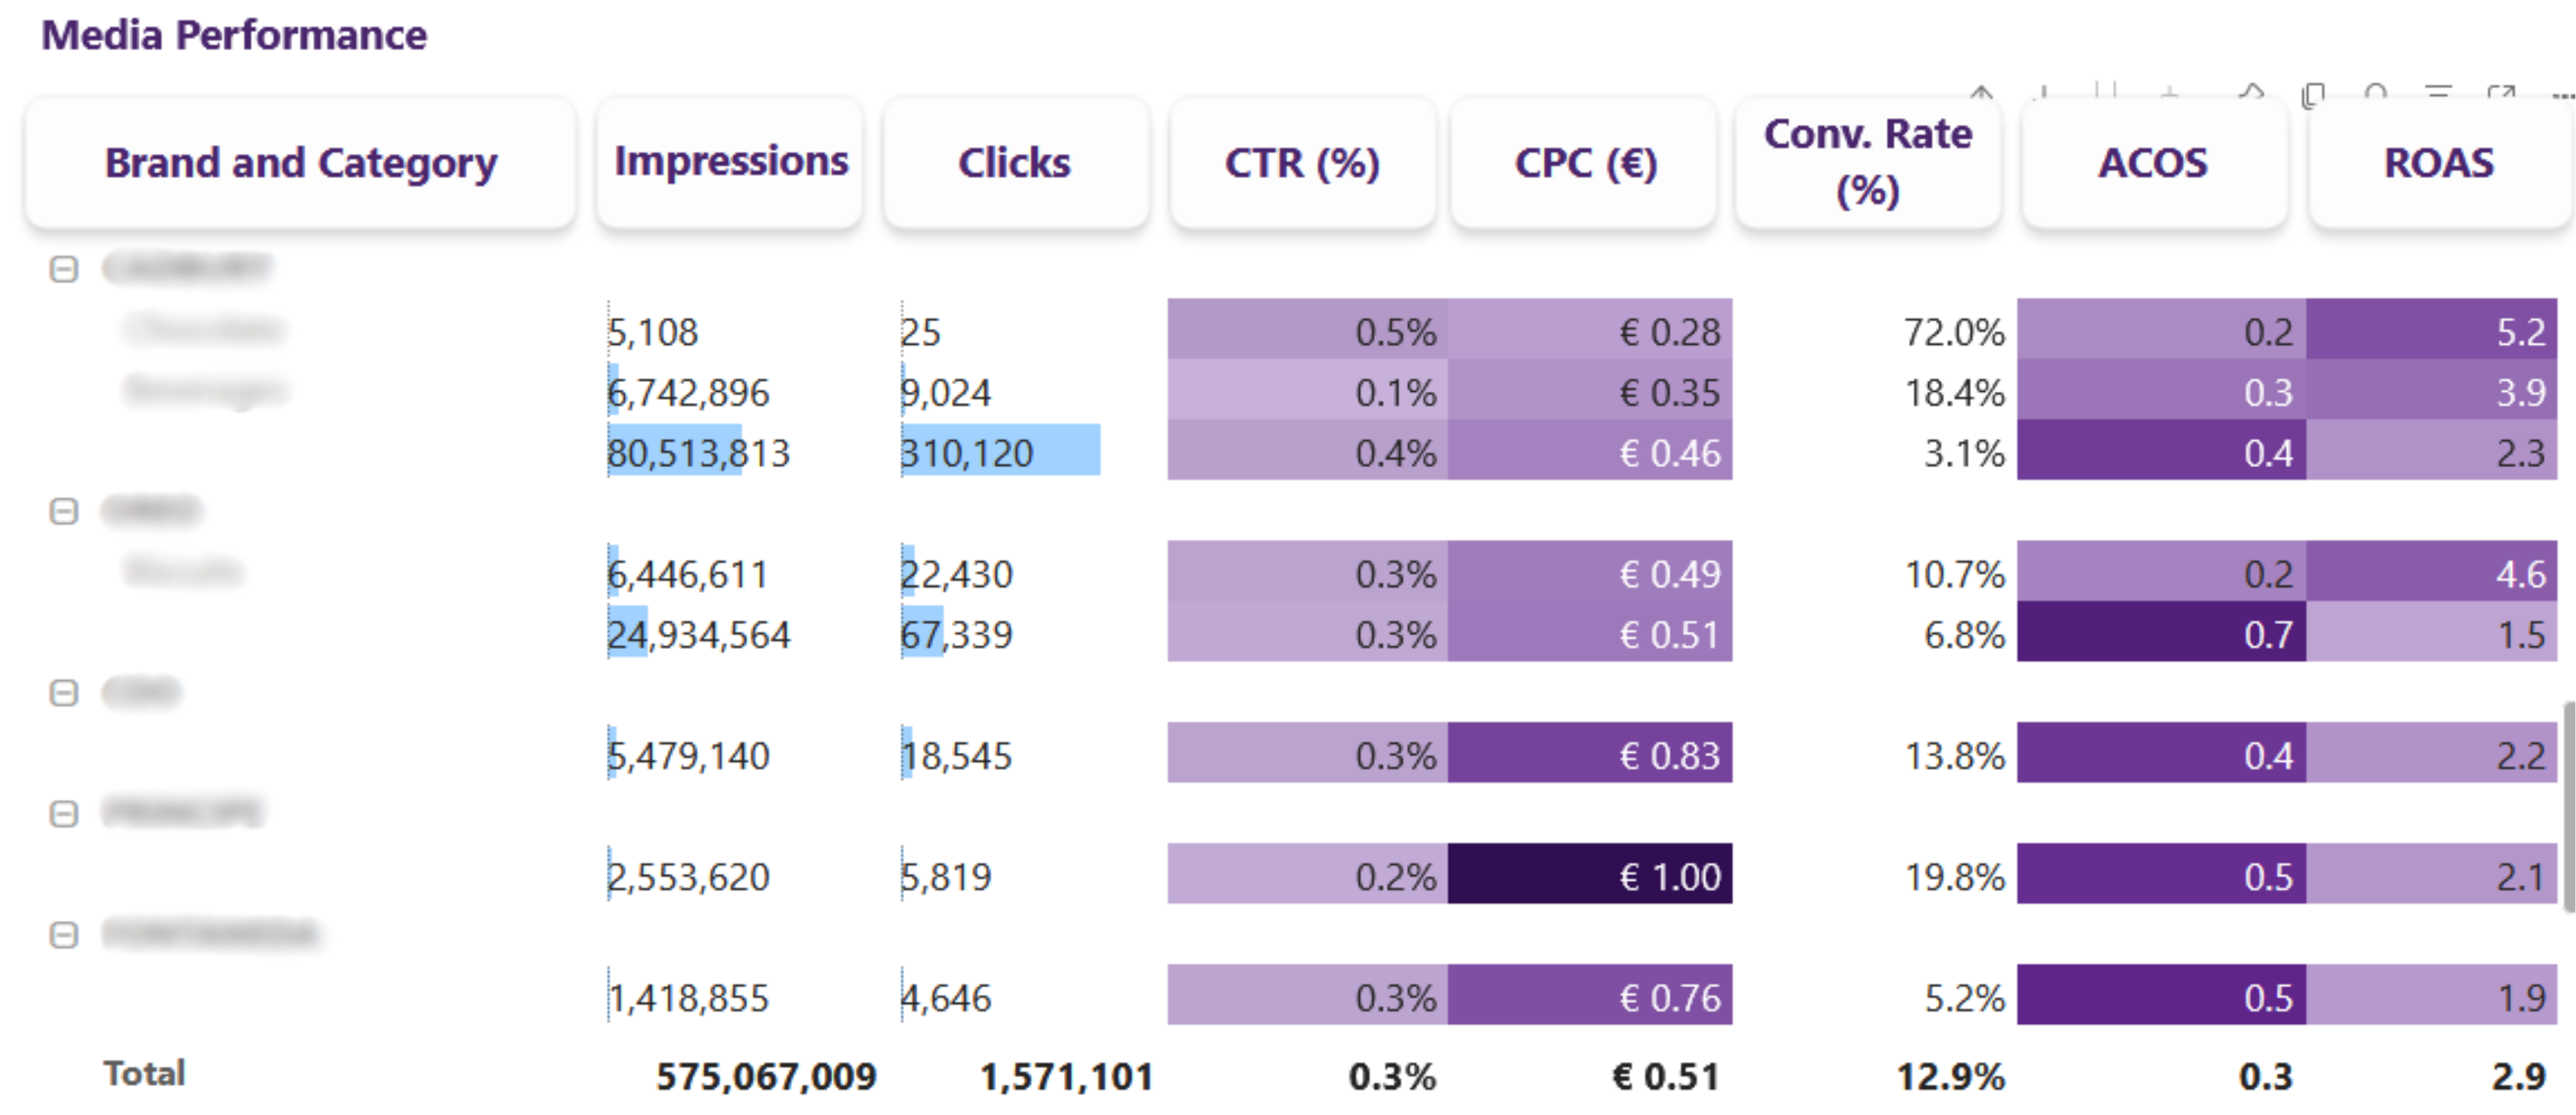
Media Performance Table: Provides a detailed view of the most important media performance metrics for each brand and category. These were used by the CMO as well as other stakeholders to draw insights about which brands and product categories were most successful, by comparing them against the targets and industry standards.
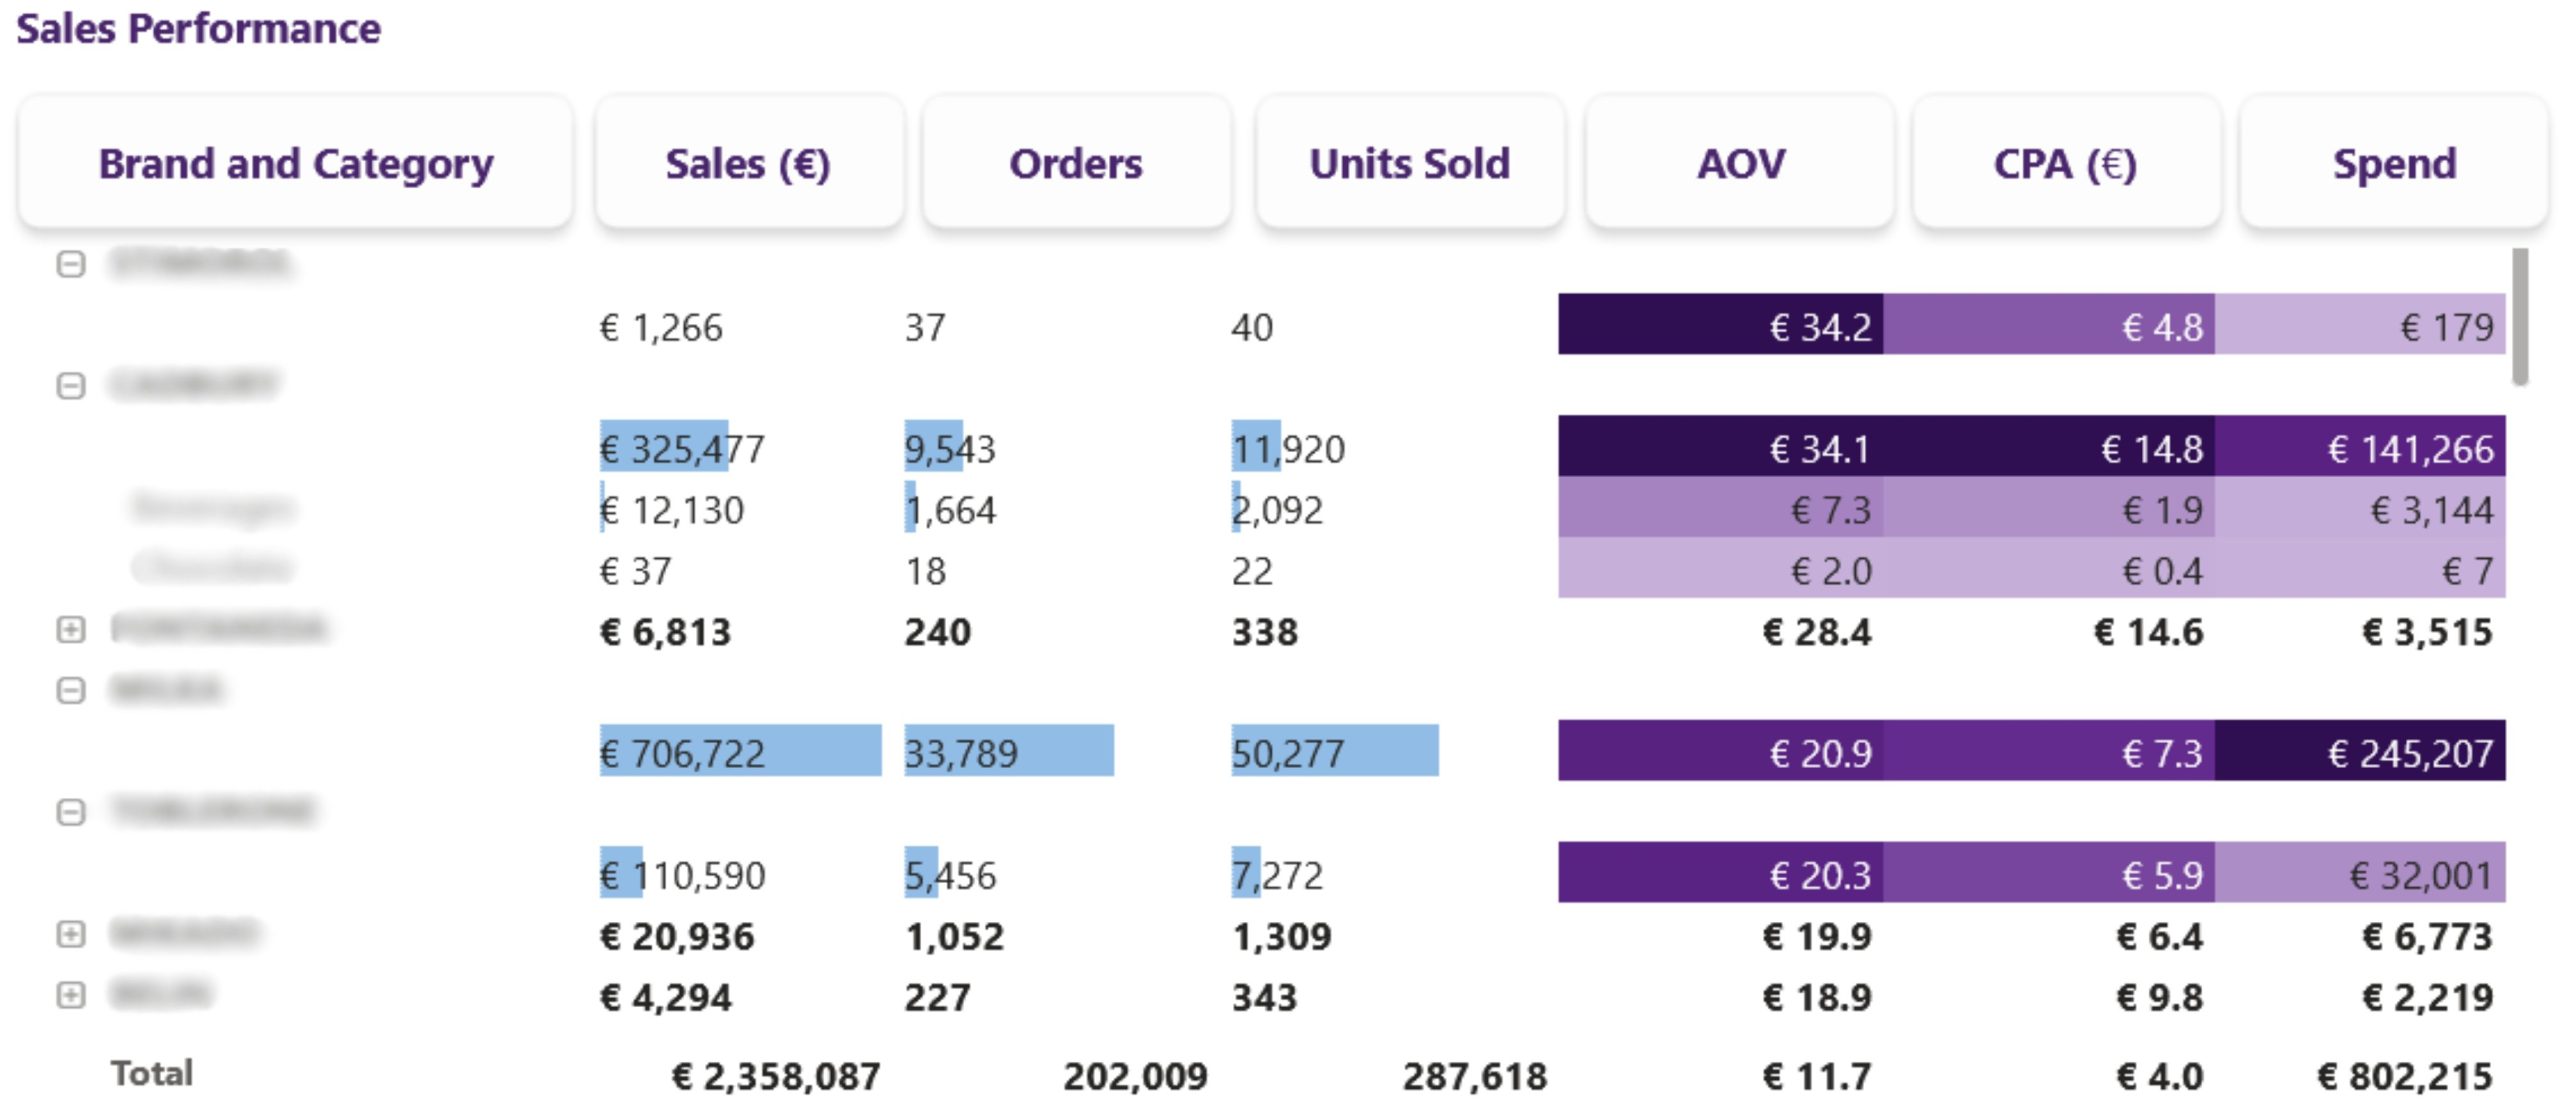
Sales Performance Table: Provides a detailed view of the most important sales performance metrics for each brand and category. These were used by the CMO as well as other stakeholders to draw insights about which brands and product categories sold the best and brought the most revenue. Similarly, the AOV (average order value), gives an insight on the brands and categories
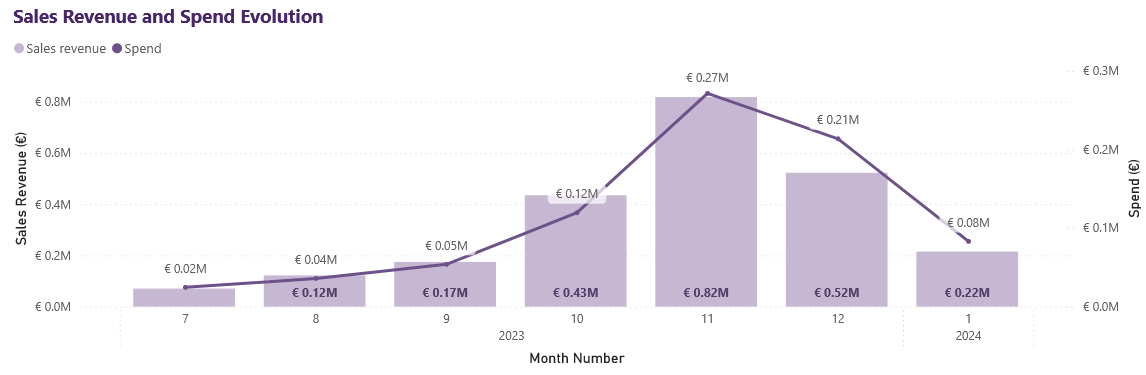
Sales Revenue and Spend Evolution: It is used to monitor the absolute values for the budget and revenue on a monthly basis. It helped executives assess the actual financial impact of marketing investments on the generated revenue.
Result
The implementation of this data analytics framework has brought multiple strategic advantages to the snack producer:
- Centralized Insights: The dashboard consolidates data from all regions and brands, providing a unified view that enhances visibility into the effectiveness of marketing campaigns on Amazon. This clarity has enabled the identification of high-performing brands and regions, guiding strategic focus.
- Enhanced Decision Making: With objective metrics like ROAS and ACOS at their fingertips, the client can make informed decisions, optimizing marketing strategies across each brand and region.
- Cost Monitoring and Budget Optimization: The dashboard ensures transparency in ad spend monitoring—critical when using external agencies— and aids in effectively allocating budgets to maximize overall ROAS.
- Scalable and Flexible Analytics: The framework is designed to accommodate growth, allowing for the integration of additional data sources and metrics to meet the client’s evolving needs.
- Improved Stakeholder Communication: By providing a user-friendly tool for monitoring campaigns, the solution facilitates easy sharing and alignment among all stakeholders, from CMOs to external media agencies.
Technologies and Tools
- Google BigQuery: for data storage and querying
- GCP Cloud Run: for running automated scripts to fetch data via API
- DBT: for data transformation and processing
- Power BI: for creating and distributing interactive dashboards through a Power BI app