Challenge: A multi-channel retailer selling furniture products across major marketplaces and their own e-commerce channels needed real-time visibility into their Thanksgiving, Black Friday, and Cyber Monday sales campaigns. The existing reporting infrastructure could not keep up with the pace of decision-making required during the most critical sales window of the year.
During peak sales events, the retailer's leadership team needed answers to time-sensitive questions: Are we outperforming last year? Which brands are driving the most revenue right now? Which sales channels are underperforming compared to the same hour yesterday? Which products should we push harder in ads over the next few hours?
Without a real-time view, these questions went unanswered until it was too late to course-correct.
The Reporting Architecture
The retailer operated a diverse data ecosystem. Sales transaction data originated in Salesforce, while third-party marketplace analytics came from Stackline and various other sources including Talkdesk for call center data.
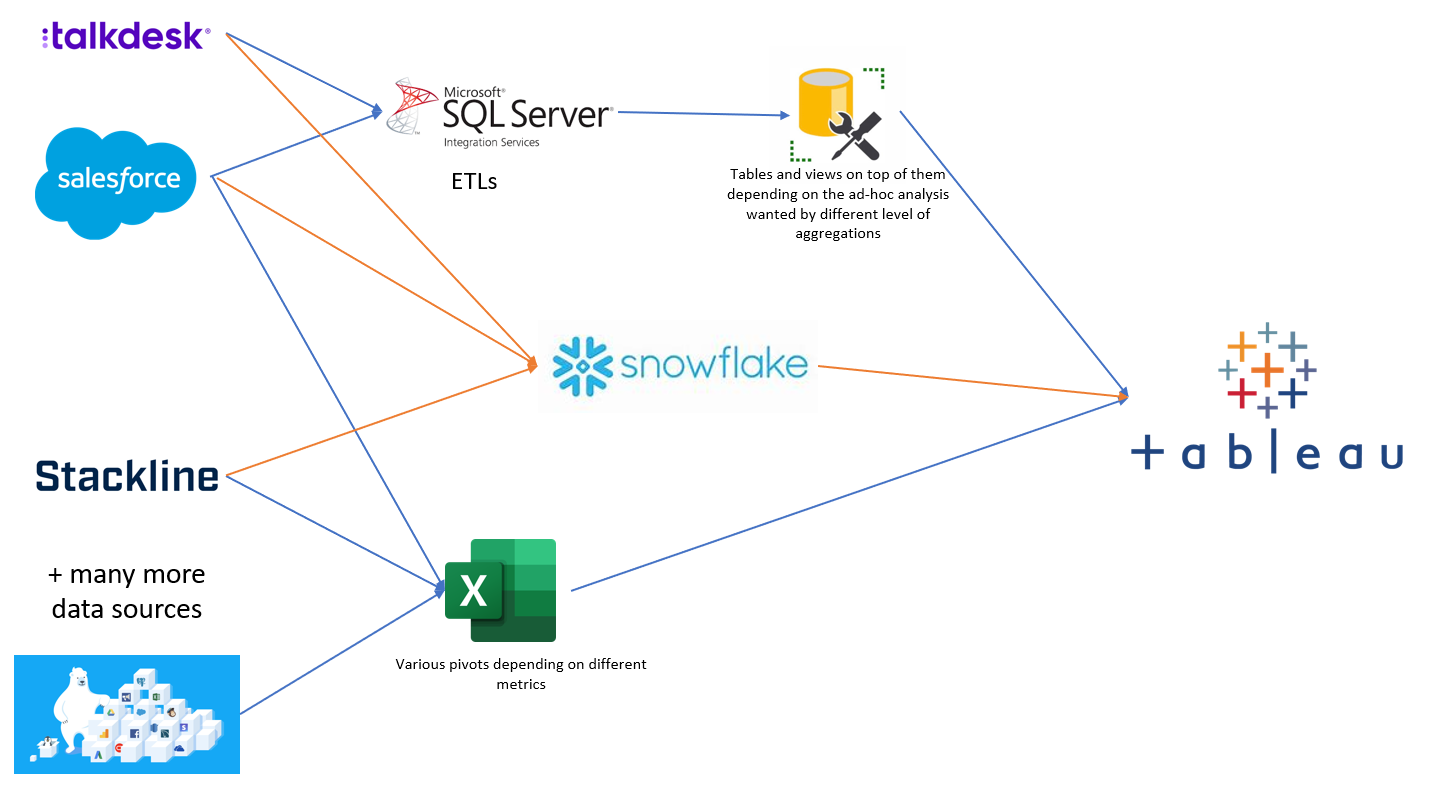
The data pipeline worked as follows:
- Salesforce, Talkdesk, Stackline, and additional data sources fed into SQL Server Integration Services (SSIS) through scheduled ETL processes.
- SSIS loaded the data into SQL Server where it was structured into tables and database views, each designed for different levels of aggregation depending on the ad-hoc analysis requirements.
- A parallel path pushed data into Snowflake for broader analytical workloads.
- Excel pivot tables were maintained alongside the BI layer for quick ad-hoc analysis on specific metrics.
- Tableau connected to both SQL Server and Snowflake as the primary reporting and visualization layer.
For the Thanksgiving and Black Friday campaign, we configured the ETL pipeline to refresh on an hourly cadence. This meant that from the moment the sales event kicked off, the leadership team had an updated view of performance every 60 minutes.
Solution
We designed and built a dedicated Tableau dashboard focused entirely on the Thanksgiving, Black Friday, and Cyber Monday sales window.
The dashboard provided four distinct analytical perspectives:
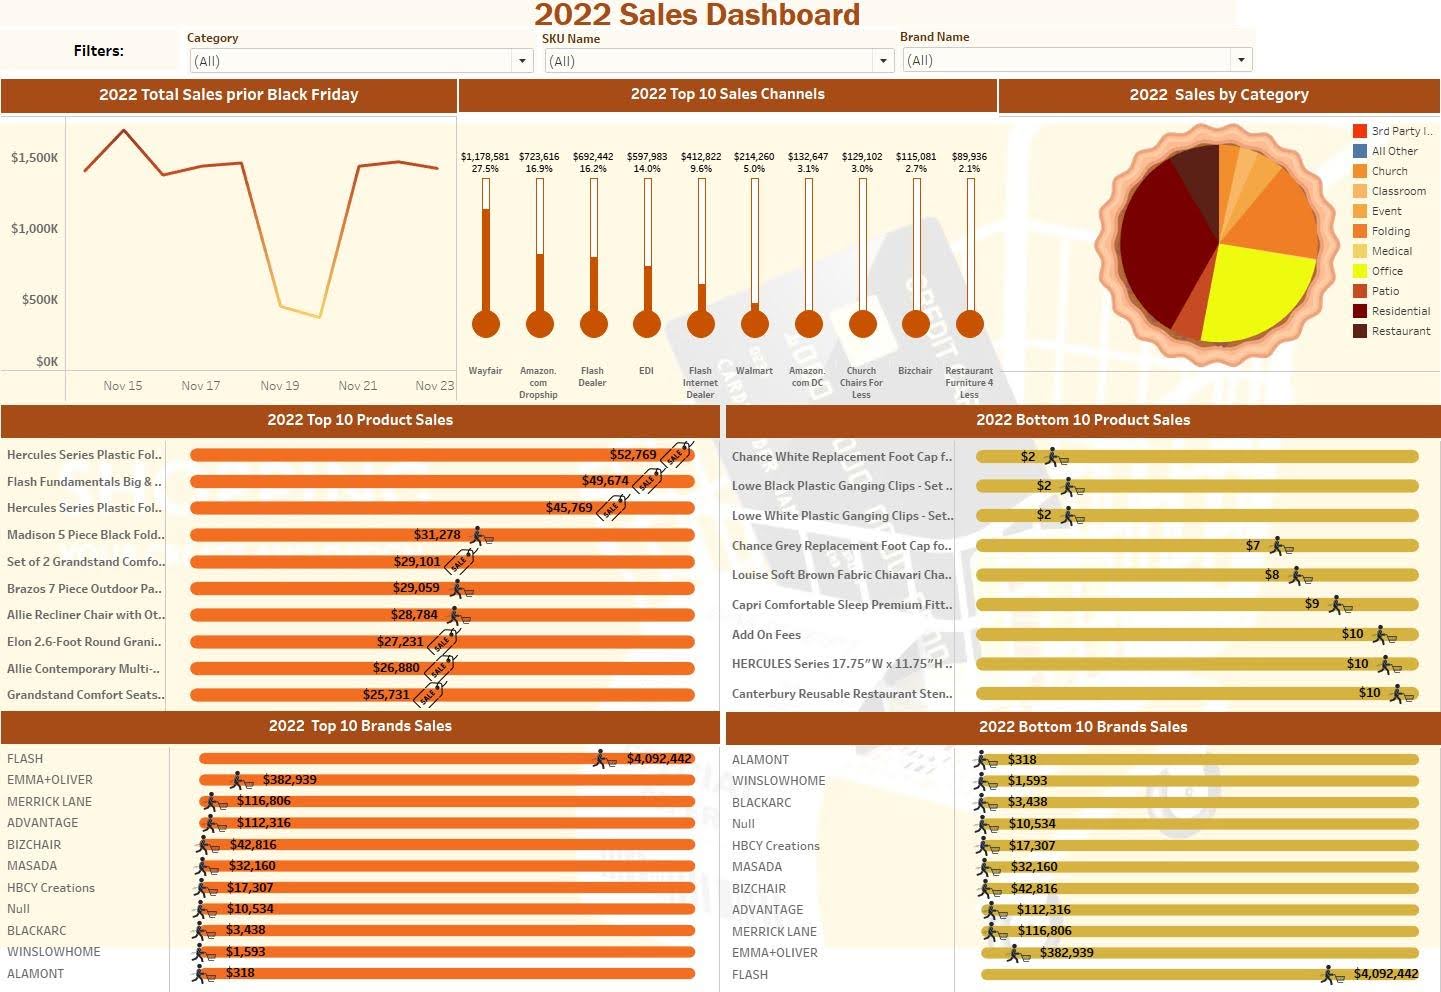
Hourly Sales Trend Monitoring
The primary view tracked total sales prior to and during the campaign period on a daily and hourly basis. This allowed the team to spot trends as they developed. A sudden dip in sales at a specific hour could trigger an immediate investigation into whether a marketplace listing had gone down, whether a competitor had launched a flash sale, or whether an ad campaign needed budget reallocation.
By overlaying current year data against the previous year's performance for the same period, the dashboard made it immediately clear whether the campaign was trending ahead or behind.
Channel Performance Breakdown
The second analytical dimension broke sales down by the top sales channels. Each channel's contribution was visible not just in absolute revenue, but as a percentage of total sales. This helped the team identify which channels were pulling their weight and which were lagging.
For example, if a particular marketplace was responsible for 27% of total sales but had been allocated only 15% of the advertising budget, the team could rebalance spend in near-real-time.
Brand and Product Rankings
The dashboard presented top 10 and bottom 10 rankings for both brands and individual products. This dual view served two purposes: it highlighted the winners that deserved more promotion, and it surfaced the underperformers that might need price adjustments, better placement, or removal from campaign landing pages.
The product-level analysis went down to individual SKUs, showing exact revenue figures. This granularity was essential for the merchandising team to make tactical decisions during the campaign window itself.
Category Distribution
A category breakdown view showed how sales distributed across product types. This was useful for understanding whether the campaign was driving broad-based growth or was concentrated in a few product categories.
Year-Over-Year Comparison
The core analytical question was simple but high-stakes: is this year better than last year?
The dashboard was built around this comparison. Every metric was paired with its prior-year equivalent. Total campaign revenue, daily revenue trajectories, channel mix, and product-level performance were all viewable side by side against the previous year.
This year-over-year lens transformed the dashboard from a monitoring tool into a strategic decision-support system. When the team saw that a particular brand had grown 40% compared to last year's Black Friday, they could confidently allocate more advertising dollars toward that brand for Cyber Monday.
Conversely, when a previously strong product showed declining sales compared to the prior year, it signaled a potential issue with pricing, inventory availability, or competitive pressure that needed immediate attention.
Results
The dashboard was delivered in time for the campaign launch and updated every hour throughout the sales event. The immediate impact was operational:
- Real-time campaign steering: The marketing team adjusted ad spend allocation across channels during the campaign based on hourly performance data, rather than waiting for end-of-day reports.
- Product-level decision speed: Merchandising decisions that previously took days of post-campaign analysis were made within hours. Underperforming products were deprioritized in ads, while top sellers received expanded visibility.
- Year-over-year confidence: Leadership had a clear, quantified answer to the question of whether the campaign was on track. This removed guesswork and reduced the anxiety that typically accompanies high-stakes sales events.
Strategic Value Beyond the Campaign
While the dashboard was built for the Thanksgiving and Black Friday window, its data and structure became a foundational asset for long-term planning.
The year-over-year product and brand performance data feeds directly into next year's campaign strategy. Brands and retailers can use insights like these to:
- Plan product promotion strategies: If a particular product category dominated Black Friday sales, it becomes a prime candidate for early advertising, pre-campaign teasers, and priority inventory stocking for the following year.
- Optimize retail placement: For brands that sell through physical and online retailers, knowing which products performed best during peak sales allows them to negotiate better shelf positioning or homepage placement. A sofa that was the top seller during Black Friday could be displayed front and center in stores or on marketplace landing pages the following year.
- Identify products for campaign-driven launches: New versions or seasonal editions of top-performing products can be timed to coincide with the next campaign cycle, leveraging proven demand patterns.
- Refine channel strategy: The channel-level performance data helps determine where to increase or decrease investment. If a marketplace delivered diminishing returns year over year, the budget can shift toward higher-performing channels.
Technology Stack
| Component | Technology |
|---|---|
| Data Sources | Salesforce, Talkdesk, Stackline, and others |
| ETL | SQL Server Integration Services (SSIS) |
| Data Warehouse | SQL Server (tables and views), Snowflake |
| Ad-hoc Analysis | Excel pivot tables |
| Reporting | Tableau |
| Refresh Rate | Hourly during campaign |