Power BI Consulting Services
Automated dashboards, not manual Excel spreadsheets
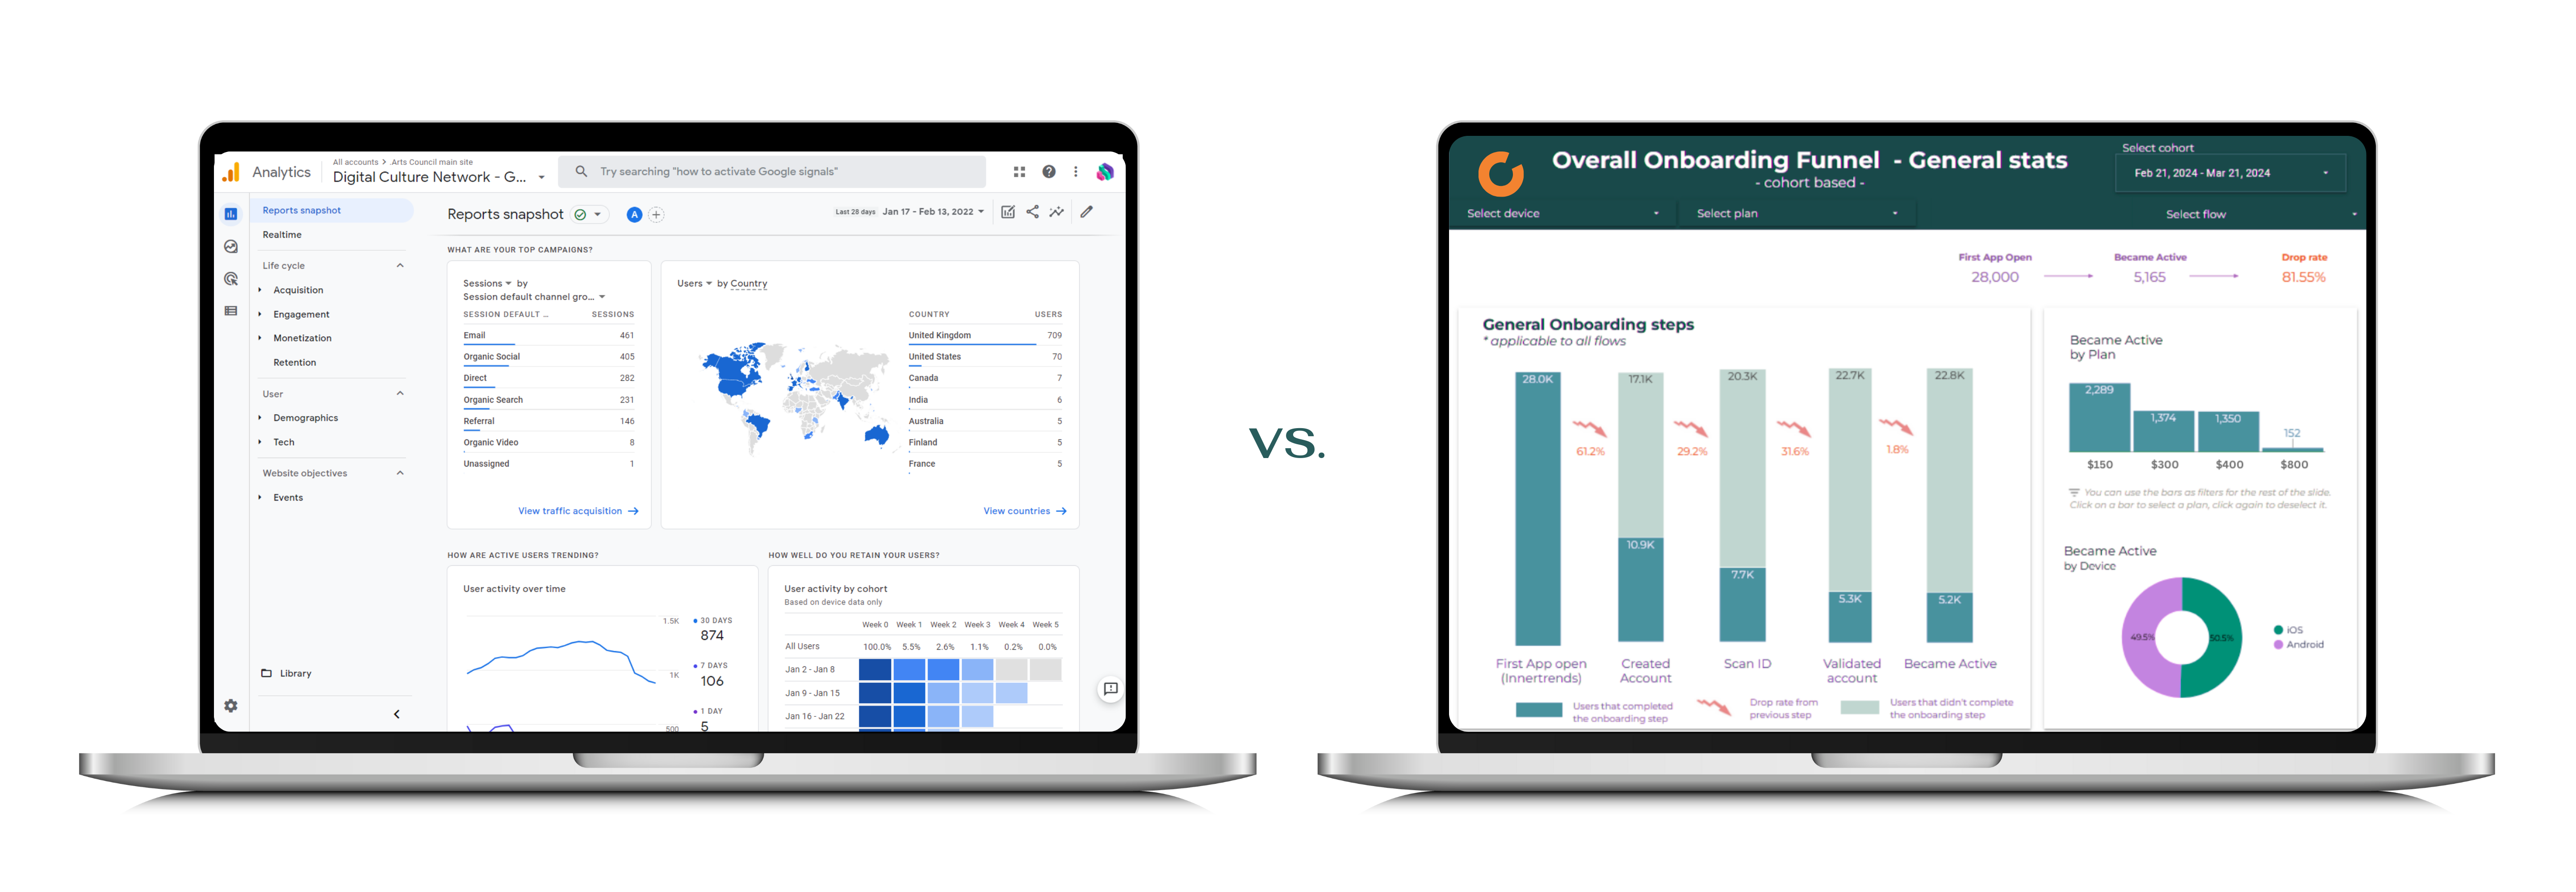
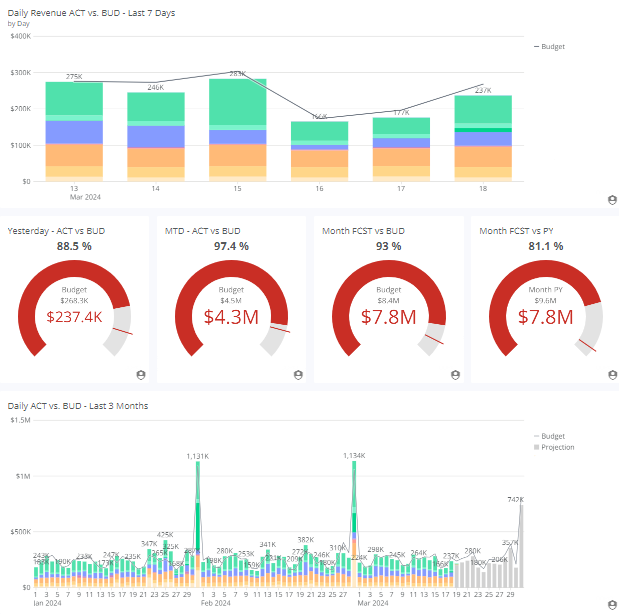
We build Power BI dashboards connected to live data sources, with automated pipelines and scheduled refreshes. Your team stops downloading CSVs and starts making decisions from real-time, interactive reports - starting at $10/user/month.
Book a Free Consultation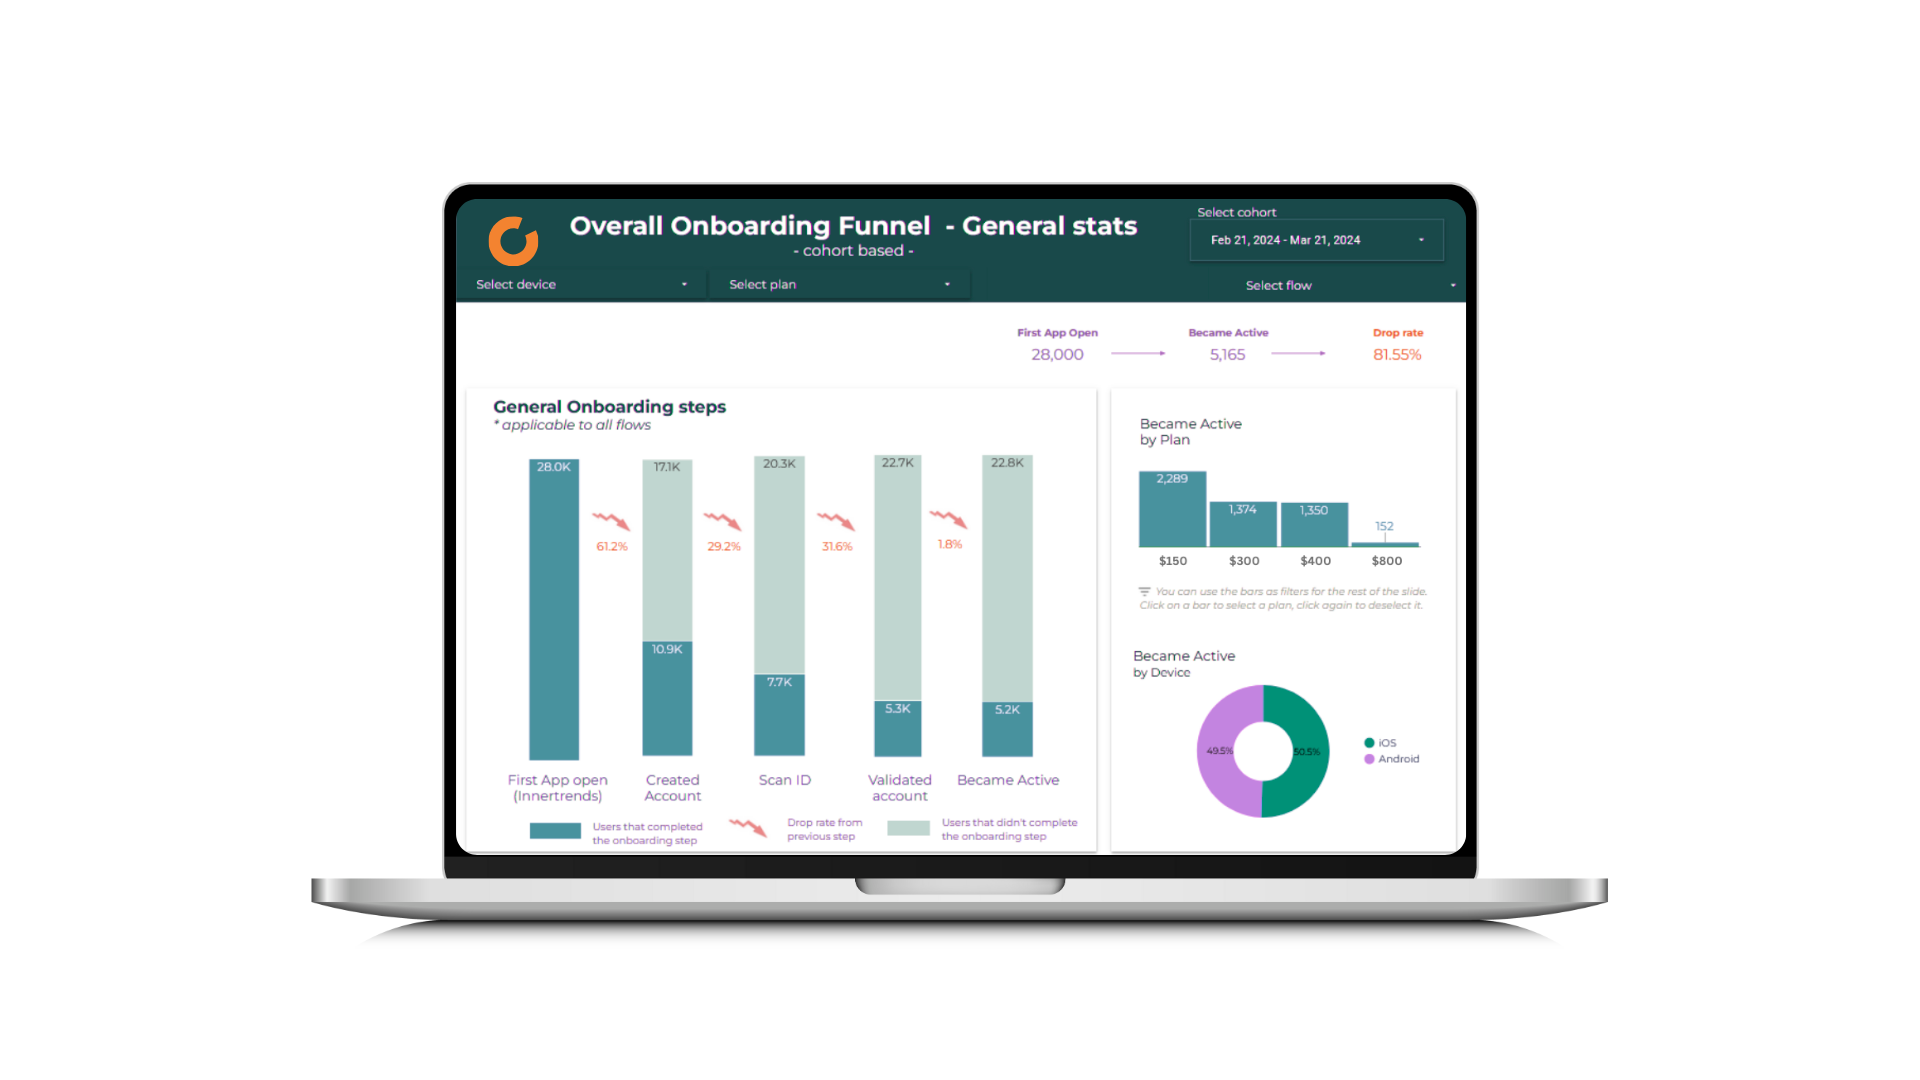
Power BI Services We Deliver
Power BI Dashboard Development
Custom interactive dashboards connected to your live data sources. We design for clarity and adoption so every stakeholder gets self-service access to the KPIs that matter.
Data Pipeline Automation
Replace CSV downloads and manual Excel refreshes with automated data pipelines. We connect your CRM, ERP, databases, and cloud services directly to Power BI with scheduled refreshes.
Data Modeling & DAX Optimization
Star schema design, DAX measure optimization, and Power Query transformations that keep your reports fast even as data volumes grow.
Power BI Gateway & Administration
Gateway setup, workspace management, row-level security, and refresh scheduling. We configure your Power BI Service environment for reliability and proper access control.
Migration to Power BI
Migrate from Excel, Google Sheets, Looker Studio, or legacy BI tools. We rebuild your reports in Power BI with improved data models and zero data loss.
Embedded Analytics & White-Label
Embed Power BI reports into your web applications, client portals, or SaaS products using Power BI Embedded, so your users consume analytics inside your product.
Training & Enablement
Hands-on training for your team on Power BI Desktop, DAX, Power Query, and report design best practices. We build internal capability so you reduce dependency on external support.
Ongoing Support & Optimization
Dashboard monitoring, performance tuning, new report requests, and data source maintenance. We keep your Power BI environment healthy as your business grows.
Power BI Case Studies
Real projects where we delivered measurable outcomes using Power BI.
Showing 3 case studies
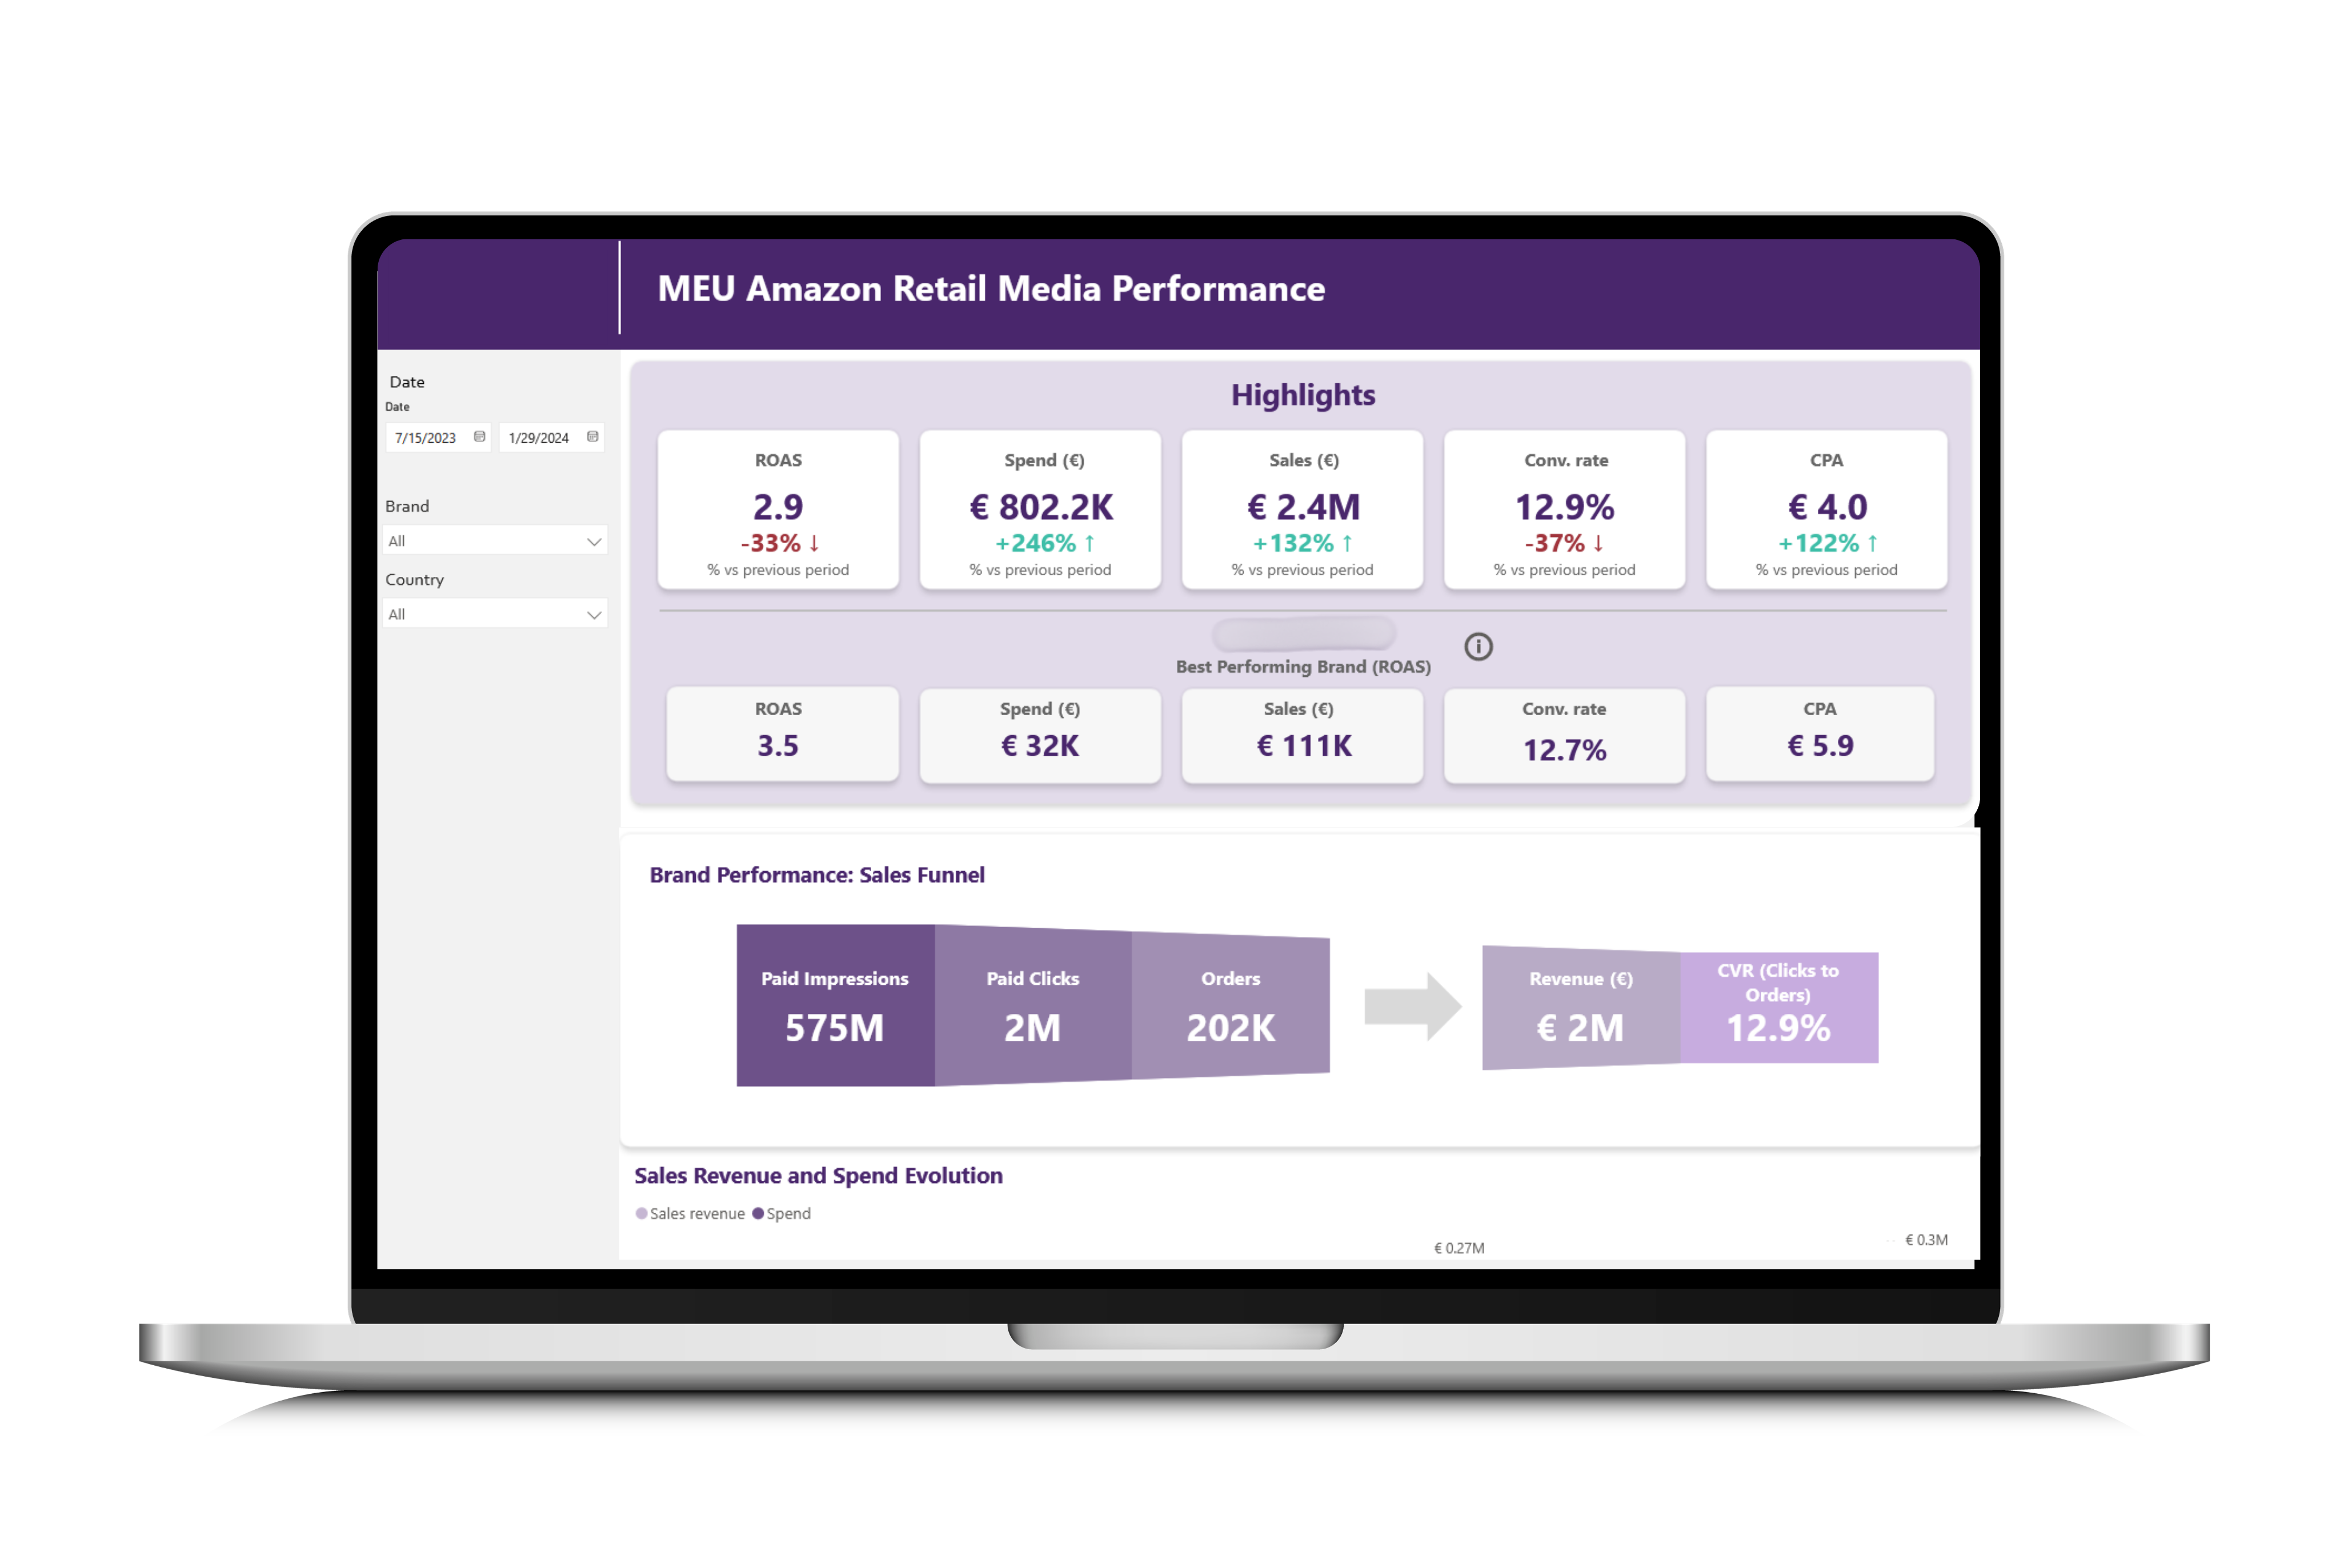
Amazon Ads Reporting with Power BI for Food & Beverage
How a snack manufacturer replaced manual Amazon Ads tracking with automated Power BI dashboards to optimize spend, measure ROAS, and guide marketing decisions.
Read case study →
Car Rental Marketplace BI: Startup Analytics with Power BI
We built the analytics stack for a car rental marketplace using MongoDB, Python, MariaDB, and Power BI to centralize operations and enable data-driven growth.
Read case study →
Marketing Automation with RFM Segmentation for a Coffee Chain
How we helped a coffee shop chain connect POS data, build RFM segmentation, and automate SMS campaigns that reduced churn by 10% and grew revenue 12%.
Read case study →Struggling with Power BI?
- Your team downloads CSVs and manually refreshes Power BI reports every week.
- Dashboards are slow because the data model was built without star schema best practices.
- You have Power BI Pro licenses but nobody is using them because the reports are confusing.
- Finance, marketing, and operations each have their own Excel files with conflicting numbers.
- You need embedded analytics in your product but do not know where to start with Power BI Embedded.
- Your IT director manages Power BI Gateway alongside 20 other responsibilities and refresh failures go unnoticed.
Why Choose Witanalytica for Power BI?
18+ Years of BI Experience
We have built dashboards in Power BI since it was Power View. Our team knows DAX, Power Query, gateways, and the Service administration deeply.
Cost-First Approach
Power BI Pro at $10/user/month is the most affordable enterprise BI tool. We design architectures that keep licensing and infrastructure costs low for mid-sized teams.
Full-Stack, Not Just Dashboards
We do not just build pretty reports. We build the data pipelines, data models, and refresh infrastructure behind them so your dashboards actually stay up to date.
Vendor-Agnostic Honesty
If Tableau or another tool is a better fit for your use case, we will tell you. We do not resell Power BI licenses and have no financial incentive to push any platform.
Our Power BI Delivery Process
We review your current reporting, identify KPIs and metrics, audit existing data sources, and document what each stakeholder needs from the dashboards.
We design the data model, define source connections, plan the ETL pipeline, and set up the Power BI workspace structure before writing a single DAX measure.
We build automated data pipelines to connect your systems - CRM, ERP, databases, APIs - to a clean data layer that feeds Power BI with scheduled refreshes.
We build the reports iteratively, sharing progress frequently so your feedback is incorporated early. Every visual follows data visualization best practices.
We cross-check dashboard numbers against your source data, validate calculations, and run user acceptance testing with your team before go-live.
We publish to Power BI Service, configure security and access, train your team on report usage and self-service capabilities, and hand over documentation.
Post-launch, we monitor dashboard adoption and performance, handle change requests, and evolve the reports as your business needs shift.
We review your current reporting, identify KPIs and metrics, audit existing data sources, and document what each stakeholder needs from the dashboards.
TESTIMONIALS
Witanalytica helped us transition from Excel to a dynamic dashboard, allowing us to view all the relevant data and the KPIs that we track as a business. Instead of having our developers code an interface for weeks, we can now instantly accomplish this process through an interface, eliminating the need for manual coding.
Radu Albastroiu
Startup Founder, masinilacheie.ro
Witanalytica’s expertise in big data engineering and visualization complements our digital media audit and customer analytics services. Collaborating with them allows us to deliver end-to-end analytics solutions and services, without the risks and investments associated with building these capabilities in-house.
Silviu Toma
Senior Partner, Microanalytics
Working with Witanalytica has transformed our approach to reporting. Their expertise in PowerBI enabled us to go beyond the limited capabilities of Excel, allowing us to provide our clients with dynamic and visually captivating PowerBI dashboards. This capability has facilitated rapid testing, iteration, and the collection of customer feedback to improve our platform.
Alin Rosca
Startup Founder, RepsMate
Our Power BI Consulting Pricing Models
Transparent pricing built for long-term partnerships, not one-off transactions.
On-Demand Expertise
All tasks are tracked, and the corresponding invoice of the delivered services is billed monthly.
| Activity | Hourly Rate |
|---|---|
| Data Engineering & Database Administration | $110 |
| Business Intelligence Reporting | $90 |
| Data Science | $120 |
Reserved Capacity Agreement
- Pre-purchase a package of monthly working hours that guarantees reserved capacity and priority availability, regardless of our workload.
- Because this capacity is exclusively allocated to you, unused hours do not carry over to the following month.
| Hours Package | Price |
|---|---|
| Every 50 hours | $4,500 10% savings |
Alternatively, we also offer project-based pricing
For well-defined engagements, we scope the full project upfront and agree on a fixed fee, so you know exactly what to expect.
Your Goals, Our Expertise
We start from your strategic objectives and work our way back to the right mix of solutions and technologies, not the other way round.
Book a Consulting CallPower BI Resources & Insights
Articles, guides, and comparisons to help you get more from Power BI.
15 articles

How to Deploy Data Analytics in Manufacturing: From Shop Floor to Boardroom
A practical guide to deploying data analytics in manufacturing logistics and supply chain, built around the five-tier meeting structure that actually runs modern factories. From shift-level dashboards to multi-plant regional operations, powered by a single source of truth.

GA4 vs Power BI vs Databases: OLTP, OLAP, and Schemas Explained
GA4, Power BI, and BigQuery handle data differently. Understand schemas, OLTP vs OLAP trade-offs, and when to use each type of data product in your stack.

Self-Service Analytics vs. Professional Analytics: How to Choose the Right Approach
Not every analytics problem needs a data team, and not every problem can be solved with a spreadsheet. This decision framework helps you determine when self-service tools are enough and when you need professional analytics support.
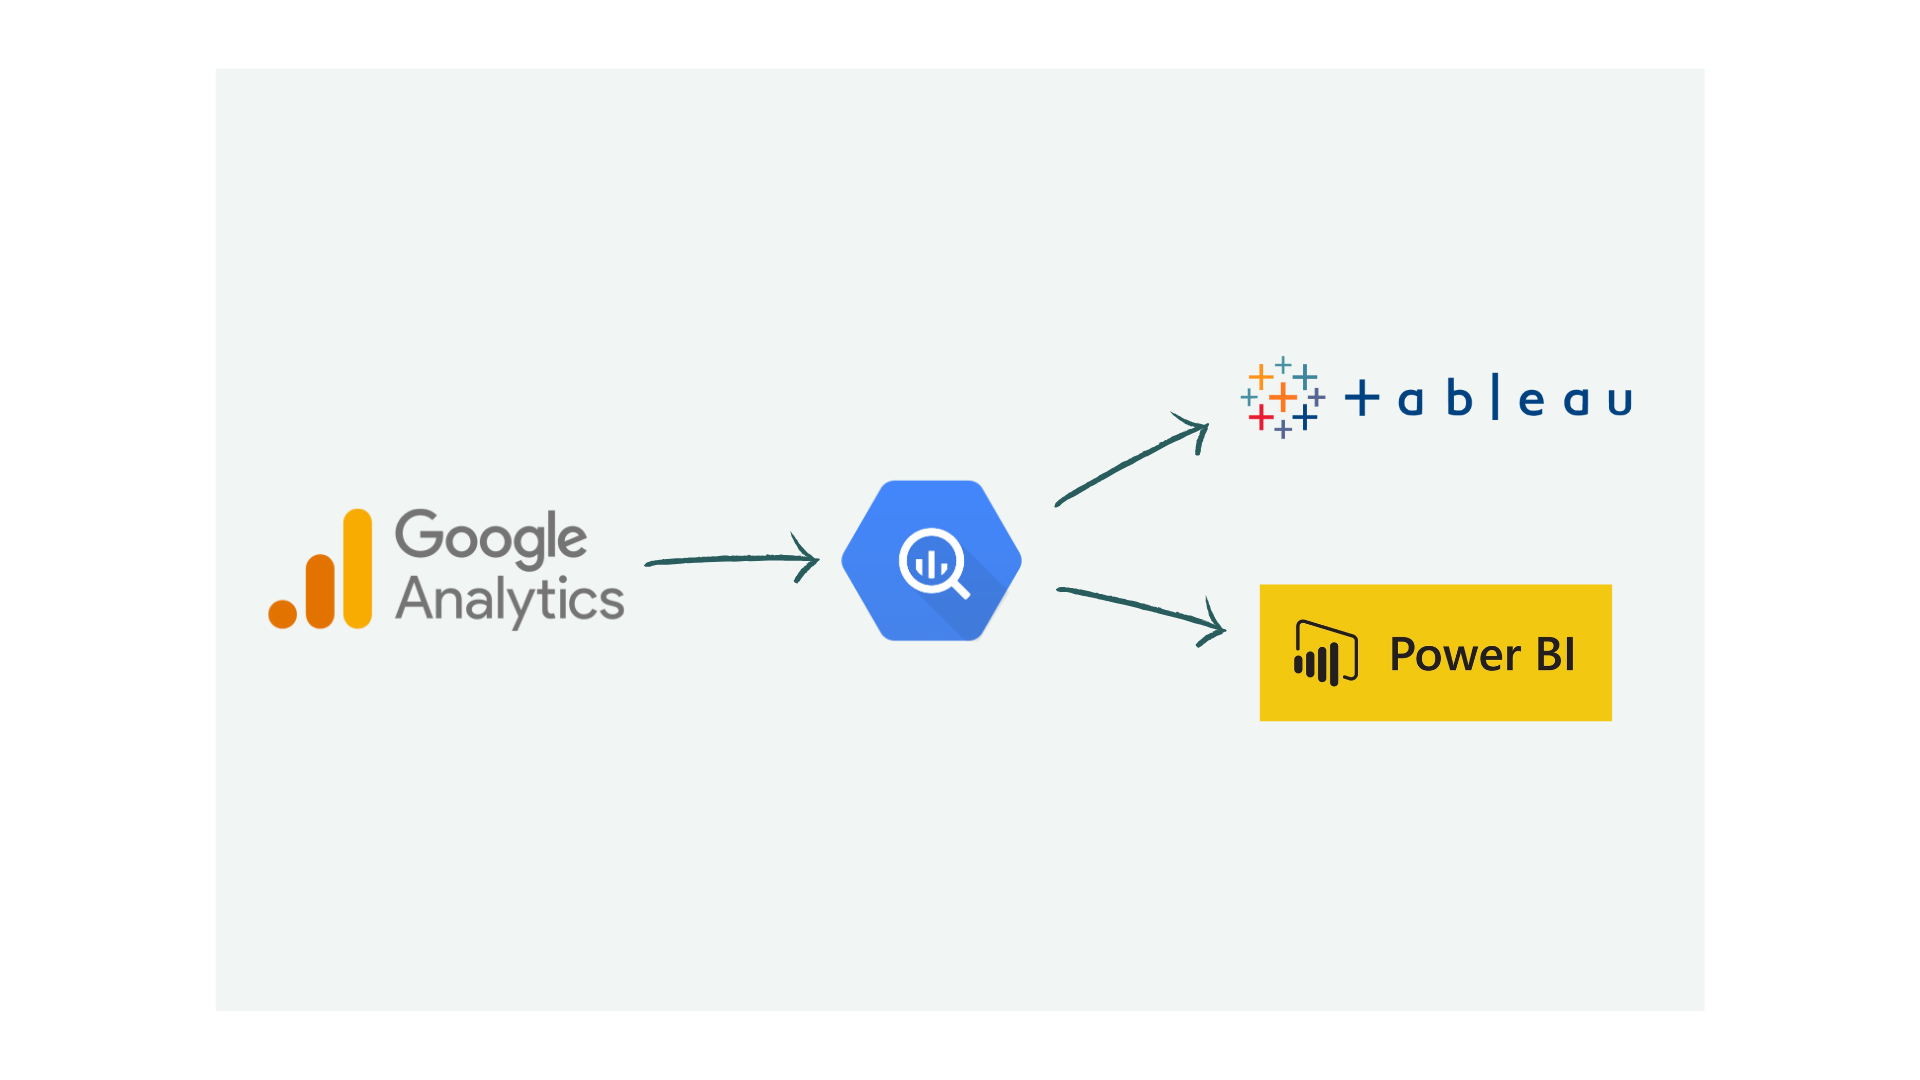
Google Analytics to BigQuery: Export Scenarios and Use Cases
GA4 data in BigQuery unlocks analytics beyond standard reports. See real scenarios: cohort analysis, ML recommendations, and cross-platform attribution.

Automate Excel and Google Sheets Reports with BI Tools
Still pasting data into spreadsheets weekly? Power BI, Tableau, and Domo automate reporting with live connections and scheduled refreshes. Here's how.
BI Tools vs Web Apps: When to Use Each (Decision Guide)
BI tools and web apps serve different purposes. Learn when to use Power BI or Tableau for analytics vs. custom web applications for operational workflows.

Data Analytics for Executives: Beyond Spreadsheets
Most teams outgrow spreadsheets before they realize it. Learn the signs you need professional analytics and what the transition actually requires.

Data Analytics for SaaS Startups: When and How to Invest
SaaS startups often delay analytics until drowning in data. Learn when to invest, common misconceptions, and how professional analytics accelerates growth.

Why Digital Marketing Agencies Need Data Analytics Partners
Marketing agencies excel at campaigns but often lack data engineering depth. Partnering with analytics specialists fills the gap and improves client outcomes.

Automate Power BI Dashboards: Stop Manual Excel Reporting
Manual Excel reporting wastes hours weekly. Automate Power BI dashboards with proper data pipelines, scheduled refreshes, and a scalable architecture.
BI Tools for Financial Reporting: Automate and Consolidate
Spreadsheet-based financial reporting is slow and error-prone. See how Power BI and Domo automate consolidation, enable drill-downs, and speed up close cycles.
BI for Reporting, Web Apps for Writeback: Choosing the Right Tool
Custom charts and Power Apps for writeback often backfire. BI tools should handle reporting while web apps manage data input and operational workflows.
Frequently Asked Questions
Our Power BI engagements typically range from a focused dashboard build (1-2 weeks) to a full analytics stack setup (2-3 months). We offer fixed-price projects, monthly retainers, and time-and-material billing. The total cost depends on the number of data sources, report complexity, and whether data engineering work is needed upstream.
Power BI is one of the best choices for mid-sized companies. Power BI Pro costs $10/user/month and includes collaboration, sharing, and scheduled refresh. You do not need Premium capacity unless you have over 500 users or need very large datasets. For most mid-sized companies, Pro is more than sufficient.
Power BI Desktop is free and runs locally for report building. Power BI Pro ($10/user/month) adds sharing, collaboration, scheduled refresh, and Power BI Service access. Premium Per User ($20/user/month) adds larger datasets, AI features, and paginated reports. Premium Capacity is for large organizations with hundreds of users.
Yes. Power BI connects natively to SQL Server, PostgreSQL, MySQL, and many cloud databases. For APIs, NoSQL databases, or custom data sources, we build Python-based ETL pipelines that transform the data and load it into a format Power BI consumes efficiently.
Yes. Slow dashboards usually result from poor data modeling (missing star schema), too many visuals per page, or unoptimized DAX. We audit your existing reports, restructure the data model, optimize measures, and often achieve 5-10x performance improvements.
We implement row-level security (RLS) so each user sees only the data they are authorized to view. We configure workspace access controls, set up the Power BI Gateway with encrypted connections, and align everything with your existing security policies and compliance requirements.
In most cases, yes. Power BI handles everything Excel does for reporting but adds automation, real-time refresh, interactive visuals, and multi-user access. The transition usually means your team stops downloading CSVs and manually updating spreadsheets.
Yes. We run hands-on training sessions covering Power BI Desktop, DAX, Power Query, and report design. Our goal is to build your team's self-service capability so they can create and modify reports independently.
A single dashboard takes 1-2 weeks. A multi-department reporting suite with data engineering takes 2-3 months. We scope every project with clear milestones and deliverables before starting.
We offer two engagement models with transparent pricing.
On-Demand Expertise
All work is tracked and billed monthly at hourly rates:
- Data Engineering & Database Administration - $110/hr
- Business Intelligence Reporting - $90/hr
- Data Science - $120/hr
Reserved Capacity Agreement
- Pre-purchase a 50-hour monthly package at $4,500 (10% savings)
- Guaranteed priority availability regardless of our workload
We also offer project-based pricing for well-defined engagements.
Contact us to discuss the best fit for your needs.