Tableau Consulting Services
Advanced visualization for data-driven decisions
We build Tableau dashboards that connect to your data sources, leverage advanced calculations, and give every team member self-service access to the insights they need. From a single workbook to a company-wide Tableau deployment.
Book a Free Consultation
Tableau Services We Deliver
Tableau Dashboard Development
Interactive workbooks with advanced visualizations, LOD calculations, and parameter-driven filters. We build dashboards that let your team explore data without waiting for IT.
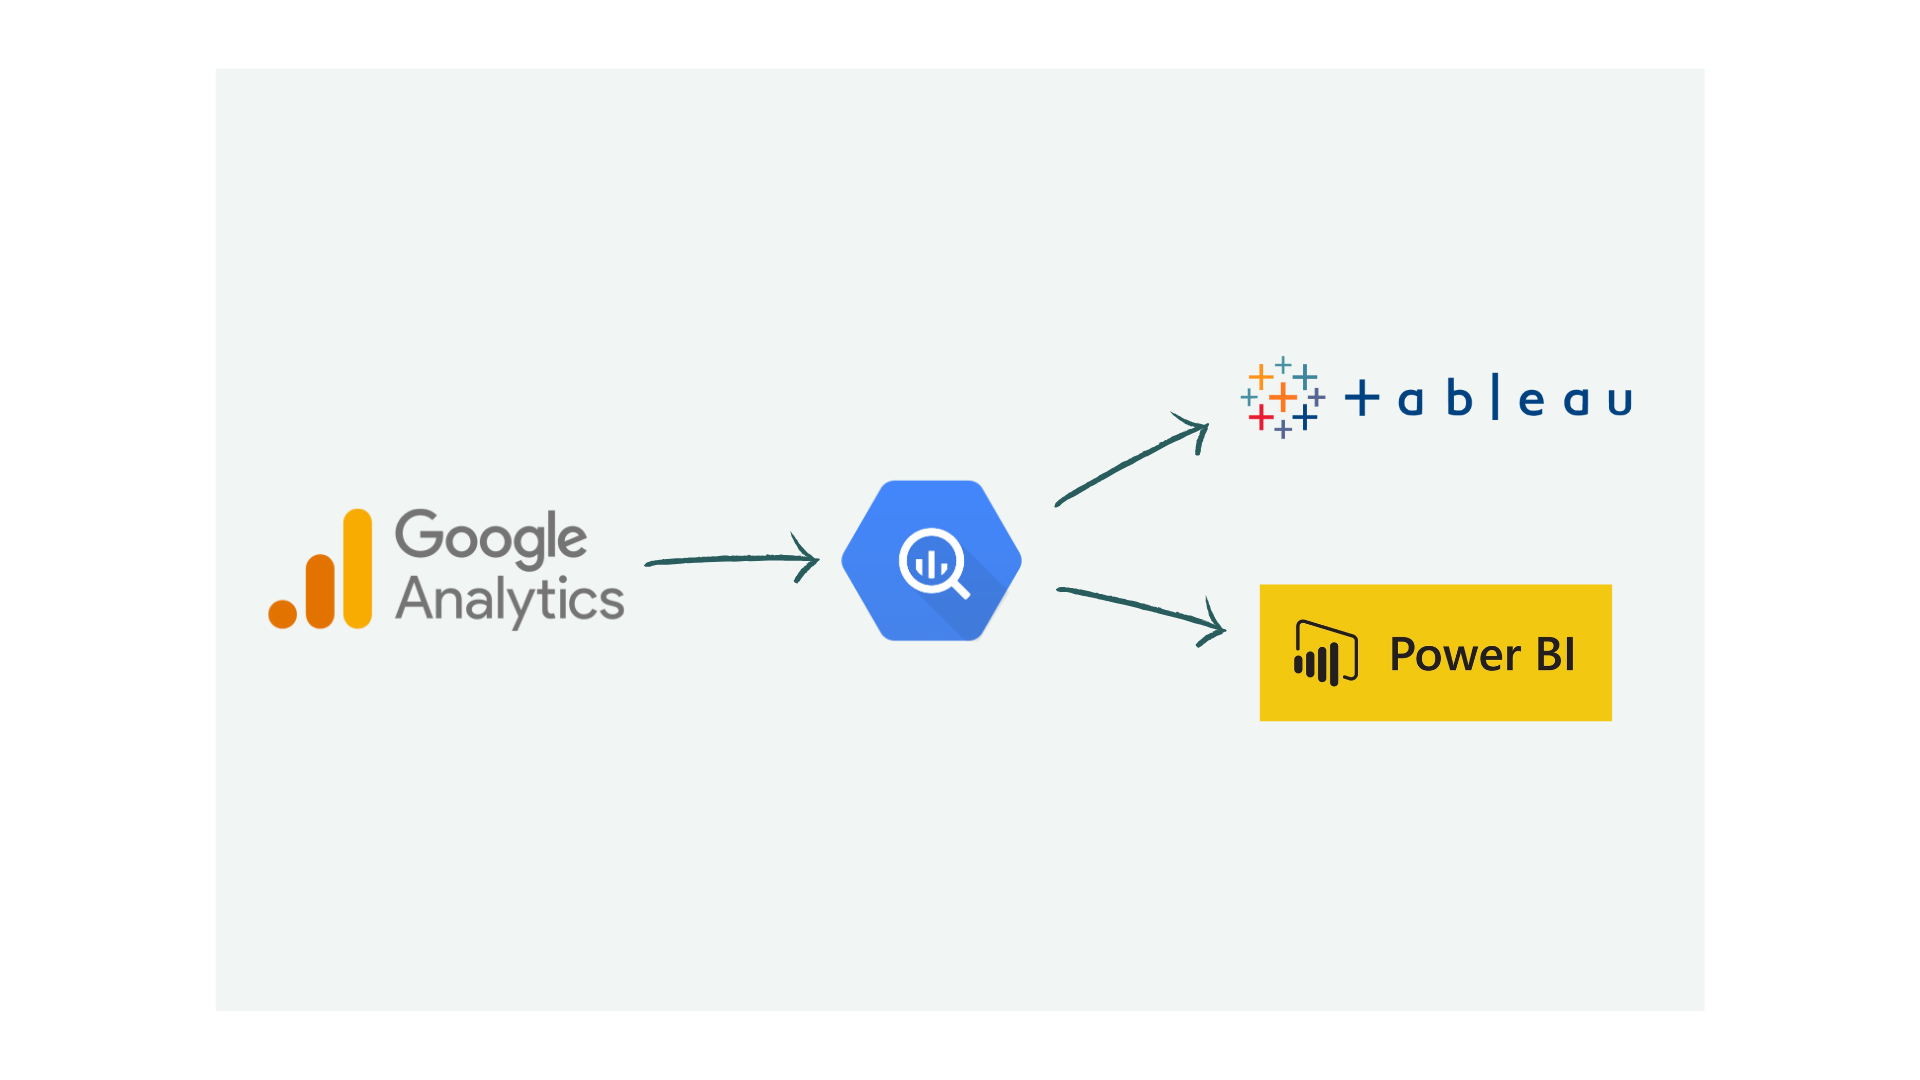
Data Source Integration
We connect Tableau to your databases, cloud warehouses, CRMs, ERPs, and APIs. Live connections or extracts, optimized for the right balance of freshness and speed.
Tableau Server & Cloud Administration
Setup, configuration, user management, and permissions for Tableau Server or Tableau Cloud. We make publishing, scheduling, and sharing reliable across your organization.
Migration to Tableau
Migrating from Excel, Looker Studio, or another BI platform? We rebuild your reports in Tableau with improved data models, proper calculations, and optimized performance.
Performance Optimization
Slow dashboards hurt adoption. We audit extract sizes, query performance, calculation complexity, and visualization design to eliminate bottlenecks.
Advanced Analytics & LOD
Level of Detail calculations, table calculations, sets, and parameters for complex analytical requirements. We handle the Tableau calculations your team does not have time to learn.
Training & Self-Service Enablement
Hands-on Tableau Desktop training for analysts and business users. We teach data connection, visualization best practices, calculations, and publishing workflows.
Ongoing Support & Maintenance
Extract refresh monitoring, report updates, new dashboard requests, and server health checks. We keep your Tableau ecosystem running smoothly.
Tableau Case Studies
Real projects where we delivered measurable outcomes using Tableau.
Showing 3 case studies

Thanksgiving & Black Friday Sales Analytics: Real-Time Campaign Monitoring
A real-time Tableau dashboard on Salesforce and SQL Server data helped a retailer monitor hourly Black Friday sales and plan next year's strategy.
Read case study →Multi-Channel Retail Profitability: Amazon vs Wholesale Analytics
A US retailer used Tableau to compare Amazon and wholesale profitability, uncovering margin differences that reshaped their distribution and pricing strategy.
Read case study →
Healthcare Data Warehouse: GA4 & CRM in BigQuery
Discover how we built a healthcare data warehouse in BigQuery, integrating GA4, CRM, and app analytics to optimize subscriptions and reduce churn.
Read case study →Struggling with Tableau?
- Your Tableau dashboards take minutes to load because extracts are too large or queries are unoptimized.
- Analysts spend more time building reports than analyzing them because LOD calculations are complex.
- Different departments have conflicting numbers because there is no single source of truth behind Tableau.
- You have Tableau licenses but low adoption because the dashboards were built without user input.
- Your Tableau Server is poorly configured and publishing or refresh failures go unnoticed.
- You are migrating from another tool and need to rebuild dozens of reports in Tableau quickly.
Why Choose Witanalytica for Tableau?
18+ Years of Visualization Experience
We have built dashboards in Tableau since v7. Our team knows LOD expressions, table calculations, data blending, and Tableau Server administration deeply.
Data Engineering Behind the Visuals
Beautiful dashboards are useless without clean data. We build the ETL pipelines and data models that feed Tableau, not just the front-end visuals.
Cross-Industry Tableau Deployments
We have deployed Tableau across retail, healthcare, manufacturing, logistics, and financial services. Each industry has different KPIs and we know what to measure.
Adoption-Focused Design
A dashboard nobody uses is wasted money. We combine visualization best practices with end-user requirements so the reports we deliver actually get adopted.
Our Tableau Delivery Process
We interview stakeholders to understand reporting needs, review existing reports, identify KPIs, and document the data sources that feed them.
We audit your data sources, assess data quality, define relationships, and plan the optimal connection strategy - live, extract, or a hybrid approach.
We design the dashboard layout, chart selection, and interaction patterns following data visualization best practices before building in Tableau.
We build dashboards in short iterations, sharing progress after each cycle so you can review, provide feedback, and adjust direction early.
We verify calculations against source data, test filter interactions, and run user acceptance testing with your team before publishing.
We publish to Tableau Server or Cloud, configure permissions and schedules, and train your team on self-service exploration and report basics.
We monitor extract refreshes, dashboard usage, and performance. As your business evolves, we update reports and add new views.
We interview stakeholders to understand reporting needs, review existing reports, identify KPIs, and document the data sources that feed them.
TESTIMONIALS
Witanalytica has been an excellent partner in managing and optimizing our Tableau environment. Their team’s technical expertise and proactive support have streamlined our reporting processes, improved dashboard performance, and provided valuable insights to our business. Their responsiveness and deep understanding of data analytics make them a trusted extension of our own team.
Mark Lack
Director of Data Analytics and AI, The Ubique Group
Working with Witanalytica has been a consistently positive experience. They are responsive, professional, and approach every revision with patience and precision. What sets them apart is a strong understanding of supply chain management, inventory planning, and sales operations, which makes collaboration efficient and ensures deliverables align with real business needs. They have also worked effectively across multiple departments in our organization and manage a 6-7 hour time zone difference seamlessly. I would confidently recommend them to any organization seeking a skilled and dependable analytics partner.
Rubin Chen
Supply Chain VP, The Ubique Group
Our Tableau Consulting Pricing Models
Transparent pricing built for long-term partnerships, not one-off transactions.
On-Demand Expertise
All tasks are tracked, and the corresponding invoice of the delivered services is billed monthly.
| Activity | Hourly Rate |
|---|---|
| Data Engineering & Database Administration | $110 |
| Business Intelligence Reporting | $90 |
| Data Science | $120 |
Reserved Capacity Agreement
- Pre-purchase a package of monthly working hours that guarantees reserved capacity and priority availability, regardless of our workload.
- Because this capacity is exclusively allocated to you, unused hours do not carry over to the following month.
| Hours Package | Price |
|---|---|
| Every 50 hours | $4,500 10% savings |
Alternatively, we also offer project-based pricing
For well-defined engagements, we scope the full project upfront and agree on a fixed fee, so you know exactly what to expect.
Your Goals, Our Expertise
We start from your strategic objectives and work our way back to the right mix of solutions and technologies, not the other way round.
Book a Consulting CallTableau Resources & Insights
Articles, comparisons, and guides to help you get more from Tableau.
12 articles

How to Deploy Data Analytics in Manufacturing: From Shop Floor to Boardroom
A practical guide to deploying data analytics in manufacturing logistics and supply chain, built around the five-tier meeting structure that actually runs modern factories. From shift-level dashboards to multi-plant regional operations, powered by a single source of truth.

Self-Service Analytics vs. Professional Analytics: How to Choose the Right Approach
Not every analytics problem needs a data team, and not every problem can be solved with a spreadsheet. This decision framework helps you determine when self-service tools are enough and when you need professional analytics support.
Google Analytics to BigQuery: Export Scenarios and Use Cases
GA4 data in BigQuery unlocks analytics beyond standard reports. See real scenarios: cohort analysis, ML recommendations, and cross-platform attribution.

Automate Excel and Google Sheets Reports with BI Tools
Still pasting data into spreadsheets weekly? Power BI, Tableau, and Domo automate reporting with live connections and scheduled refreshes. Here's how.
BI Tools vs Web Apps: When to Use Each (Decision Guide)
BI tools and web apps serve different purposes. Learn when to use Power BI or Tableau for analytics vs. custom web applications for operational workflows.

Data Analytics for Executives: Beyond Spreadsheets
Most teams outgrow spreadsheets before they realize it. Learn the signs you need professional analytics and what the transition actually requires.

Why Digital Marketing Agencies Need Data Analytics Partners
Marketing agencies excel at campaigns but often lack data engineering depth. Partnering with analytics specialists fills the gap and improves client outcomes.
BI Tools for Financial Reporting: Automate and Consolidate
Spreadsheet-based financial reporting is slow and error-prone. See how Power BI and Domo automate consolidation, enable drill-downs, and speed up close cycles.
BI for Reporting, Web Apps for Writeback: Choosing the Right Tool
Custom charts and Power Apps for writeback often backfire. BI tools should handle reporting while web apps manage data input and operational workflows.
Looker Studio Alternatives: Why Power BI and Tableau Are Superior
Looker Studio handles basic dashboards but lacks advanced modeling and governance. See why Power BI and Tableau are stronger choices for serious analytics.
Domo vs Tableau vs Power BI: Feature and Cost Comparison
Choosing between Domo, Tableau, and Power BI? Compare pricing, ease of use, data connectivity, governance, and best-fit scenarios for each platform.

Data Analytics Adoption: A 5-Stage Enterprise Framework
Adopting analytics requires more than tools. This framework covers stakeholder alignment, maturity assessment, roadmap planning, and phased implementation.
Frequently Asked Questions
Consulting costs depend on the scope: a single dashboard build takes 1-2 weeks, while a full analytics suite with data engineering may span 2-3 months. We offer fixed-price, retainer, and time-and-material models. Contact us for a scoped estimate.
Power BI is more cost-effective for Microsoft-heavy environments ($10/user/month). Tableau excels at complex visual exploration, cross-platform data connectivity, and organizations that need advanced calculations. We are experts in both and recommend based on your ecosystem, not our preference.
Tableau Creator costs approximately $75/user/month and includes Desktop and Server/Cloud publishing. Tableau Explorer ($42/user/month) allows editing published workbooks. Tableau Viewer ($15/user/month) is for viewing dashboards. For a team of 10-50 users, a typical mix of Creator + Viewer licenses keeps costs reasonable.
Yes. Tableau connects natively to BigQuery, Snowflake, Redshift, Azure Synapse, and most databases. We configure live or extract connections depending on your data volume and refresh needs.
Yes. Common causes include oversized extracts, inefficient calculations, too many marks on a page, and unoptimized data sources. We audit and restructure for performance - improvements of 5-10x are typical.
Both. Tableau Cloud is simpler to manage and better for smaller teams. Tableau Server gives more control over security and data governance. We help you choose, configure, and maintain whichever fits your organization.
Yes. We offer hands-on training on Tableau Desktop (connecting data, building visualizations, calculations, publishing), and Tableau Server/Cloud (publishing, scheduling, permissions). Training sessions are tailored to your team's current skill level.
A focused dashboard takes 1-2 weeks. A multi-department deployment with data engineering typically takes 6-12 weeks. We define milestones and deliverables upfront so you know what to expect.
Yes. We use Tableau Prep for visual data preparation when it fits the use case, though for more complex ETL scenarios we typically use Python or dbt for better scalability and version control.
We offer two engagement models with transparent pricing.
On-Demand Expertise
All work is tracked and billed monthly at hourly rates:
- Data Engineering & Database Administration - $110/hr
- Business Intelligence Reporting - $90/hr
- Data Science - $120/hr
Reserved Capacity Agreement
- Pre-purchase a 50-hour monthly package at $4,500 (10% savings)
- Guaranteed priority availability regardless of our workload
We also offer project-based pricing for well-defined engagements.
Contact us to discuss the best fit for your needs.