Challenge: A mature U.S. 3PL operator was losing money across transportation and warehouse operations.
Driver paperwork and Excel-based invoicing failed to capture all billable activities. Operational data was isolated across WMS, telematics, and CRM systems. There was no real-time visibility into margins by customer, route, or service.
In a thin-margin industry, fragmented systems were turning operational complexity into financial loss.
Operational complexity increased dramatically:
- Transportation revenue depended on driver time, wait time, kilometers, fuel adjustments, storage, and ad-hoc services.
- Warehouse profitability depended on SKU movement, storage duration, and handling costs.
- Finance had no real-time margin visibility.
- Sales pipeline data was disconnected from operations.
- Historical WMS data was locked in a legacy system.
- Invoice generation relied heavily on manual Excel processes.
The consequences were severe:
- Revenue leakage due to unbilled driver wait times and ancillary services
- Inconsistent invoice logic across customers
- No clear understanding of margin per client, route, or service type
- Inability to connect pipeline growth with operational capacity
- Growing dependency on third-party data connectors (Fivetran) with limited flexibility
In logistics, margins are thin. Small inaccuracies compound into significant financial impact.
Solution
We designed and implemented a logistics data analytics architecture that connected operations, finance, sales, and warehouse intelligence into a unified ecosystem.
Here is how we did it.
Margin Visibility in Workday Adaptive Planning
From WMS Transactions to Financial Cube Modeling
Finance teams were unable to properly analyze margin by:
- Customer
- Route
- Service type
- Warehouse operation
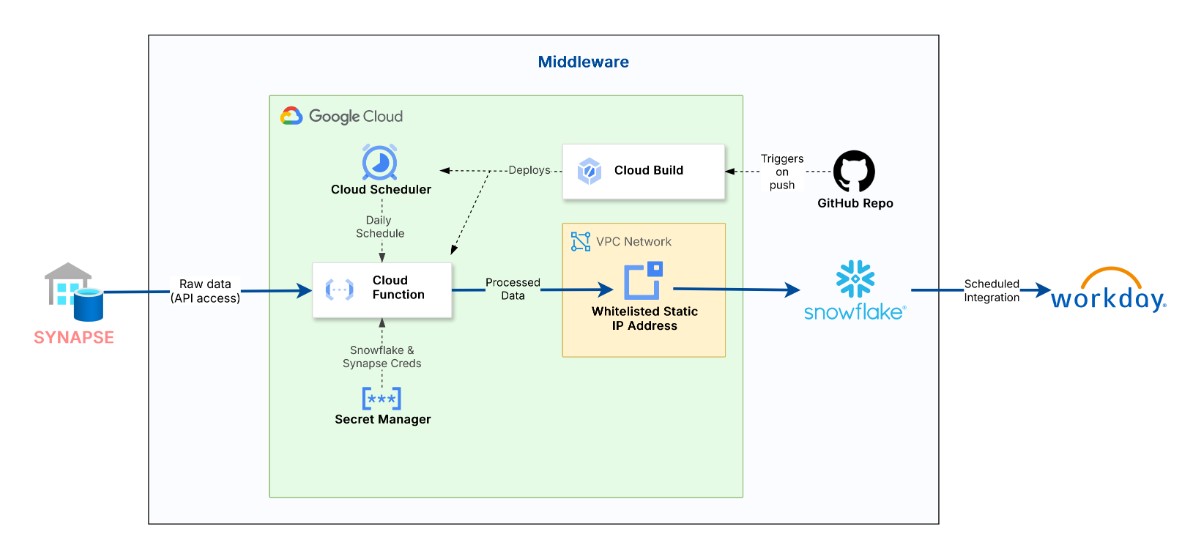
We built an automated pipeline that:
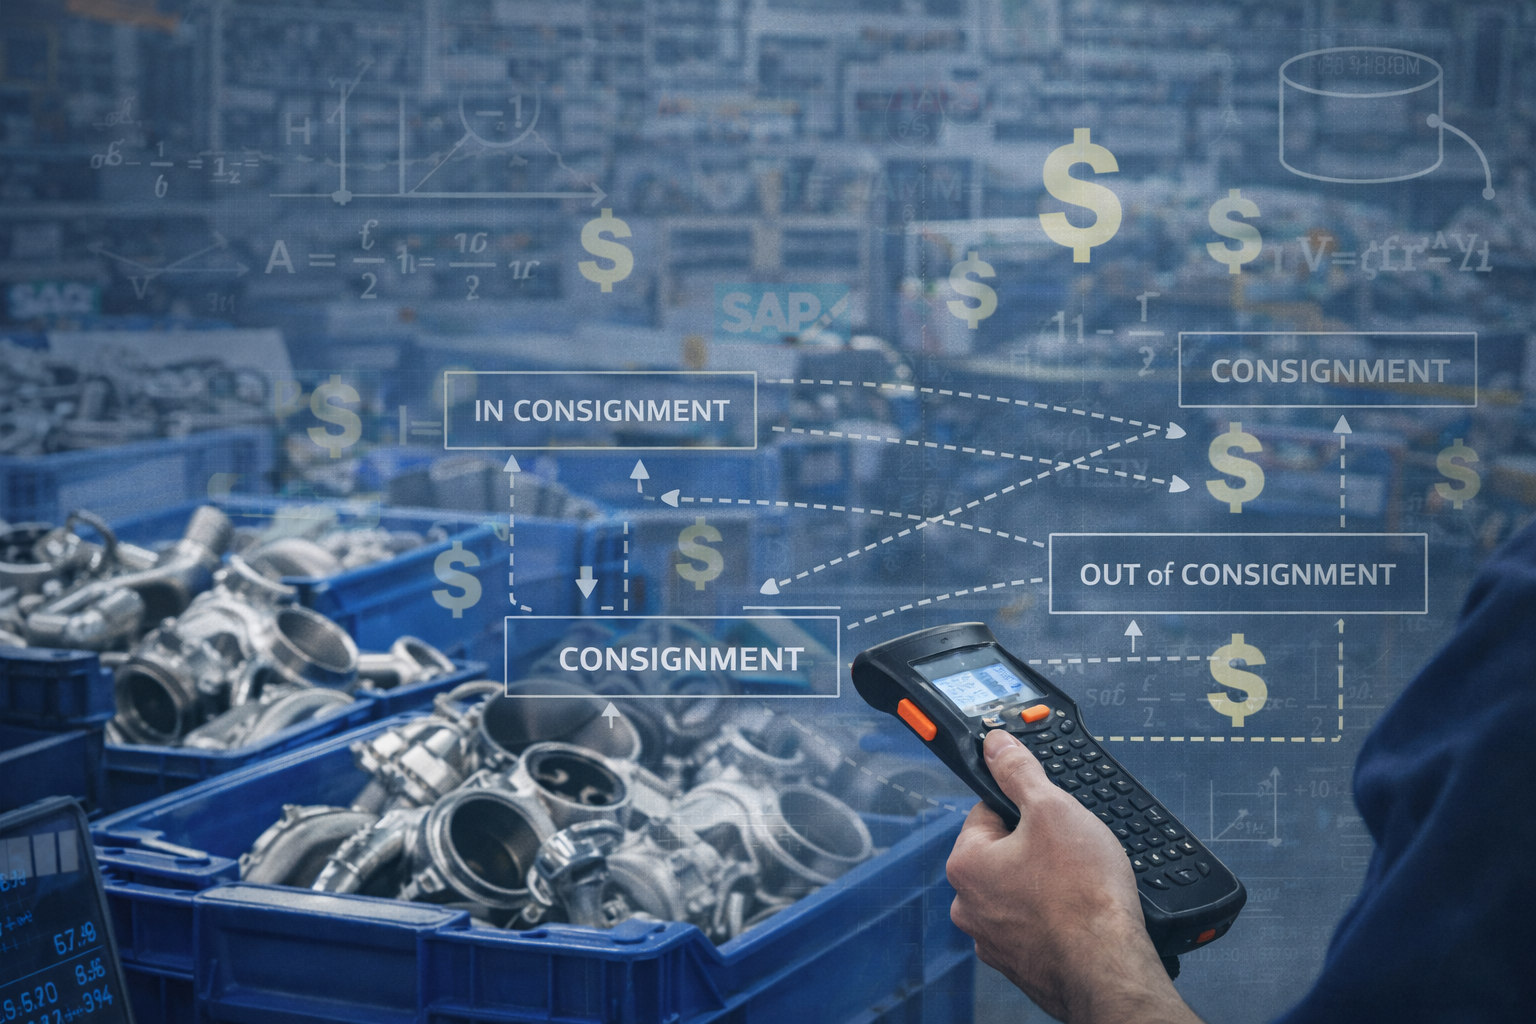
- Extracts operational data from the Synapse Warehouse Management System
- Standardizes cost and revenue mappings
- Transforms operational metrics into financial-ready models
- Pushes structured data into the Workday Adaptive Planning cube
This enabled:
- Margin analysis by customer and service line
- Scenario planning and forecasting
- Alignment between operational performance and financial reporting
For the first time, finance could see operational reality reflected in financial planning without having to manually export Excel files and upload them to Workday.
Automated Transportation Invoicing from Samsara Telemetry
Eliminating Revenue Leakage
Manual invoicing in logistics is dangerous. Driver wait times, detention charges, load handling, kilometers driven, and storage often get partially billed or not billed at all. The client previously relied on Excel-based processes.
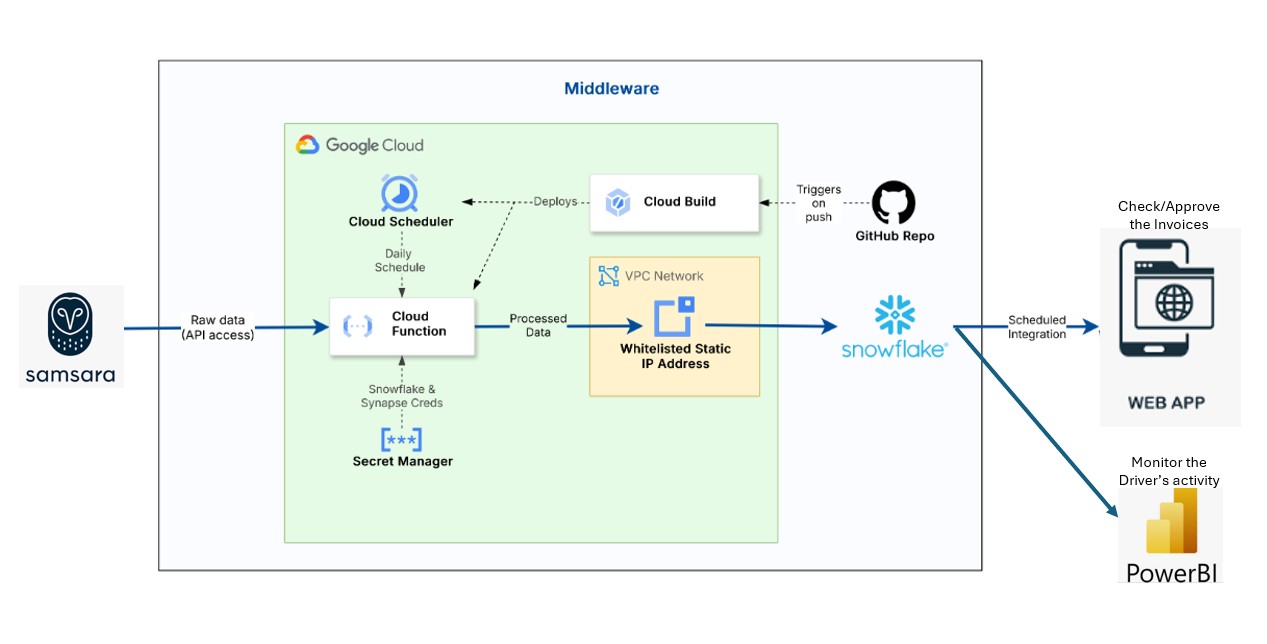
We developed a custom invoicing engine that:
- Pulls truck and driver telemetry data from Samsara
- Calculates billable hours, wait times, distance, and load activity
- Applies customer-specific pricing logic
- Generates structured invoice-ready datasets
This ensured:
- All billable activities were captured
- Invoice consistency across customers
- Reduced manual processing time
- Increased billing accuracy
In industries where margins are often 5-10%, invoice precision is critical. Here is how the system works end to end:
Real-Time Fleet Visibility
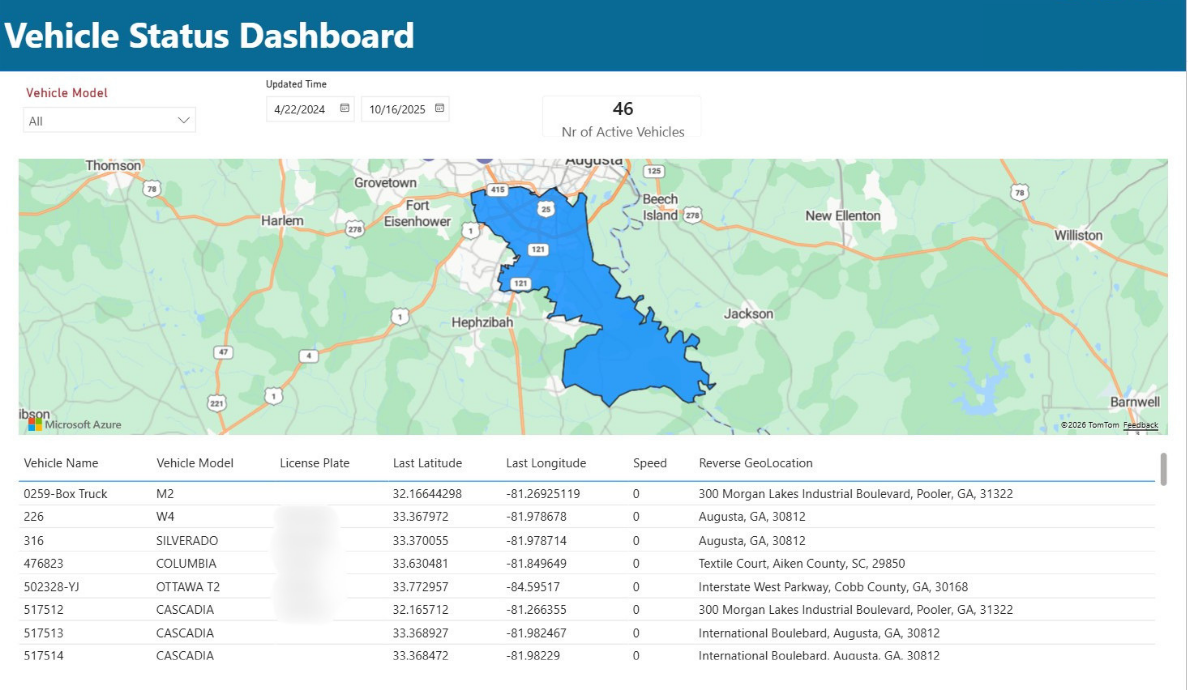
Before billing can be accurate, operations needs to know where every truck is and whether it is loaded or idle. The Vehicle Status Dashboard pulls live GPS and telematics data from Samsara, showing all active vehicles on a map alongside their model, license plate, speed, and last known address. Dispatchers use this view to maximize fleet utilization by spotting idle trucks, rebalancing loads, and reducing empty miles.
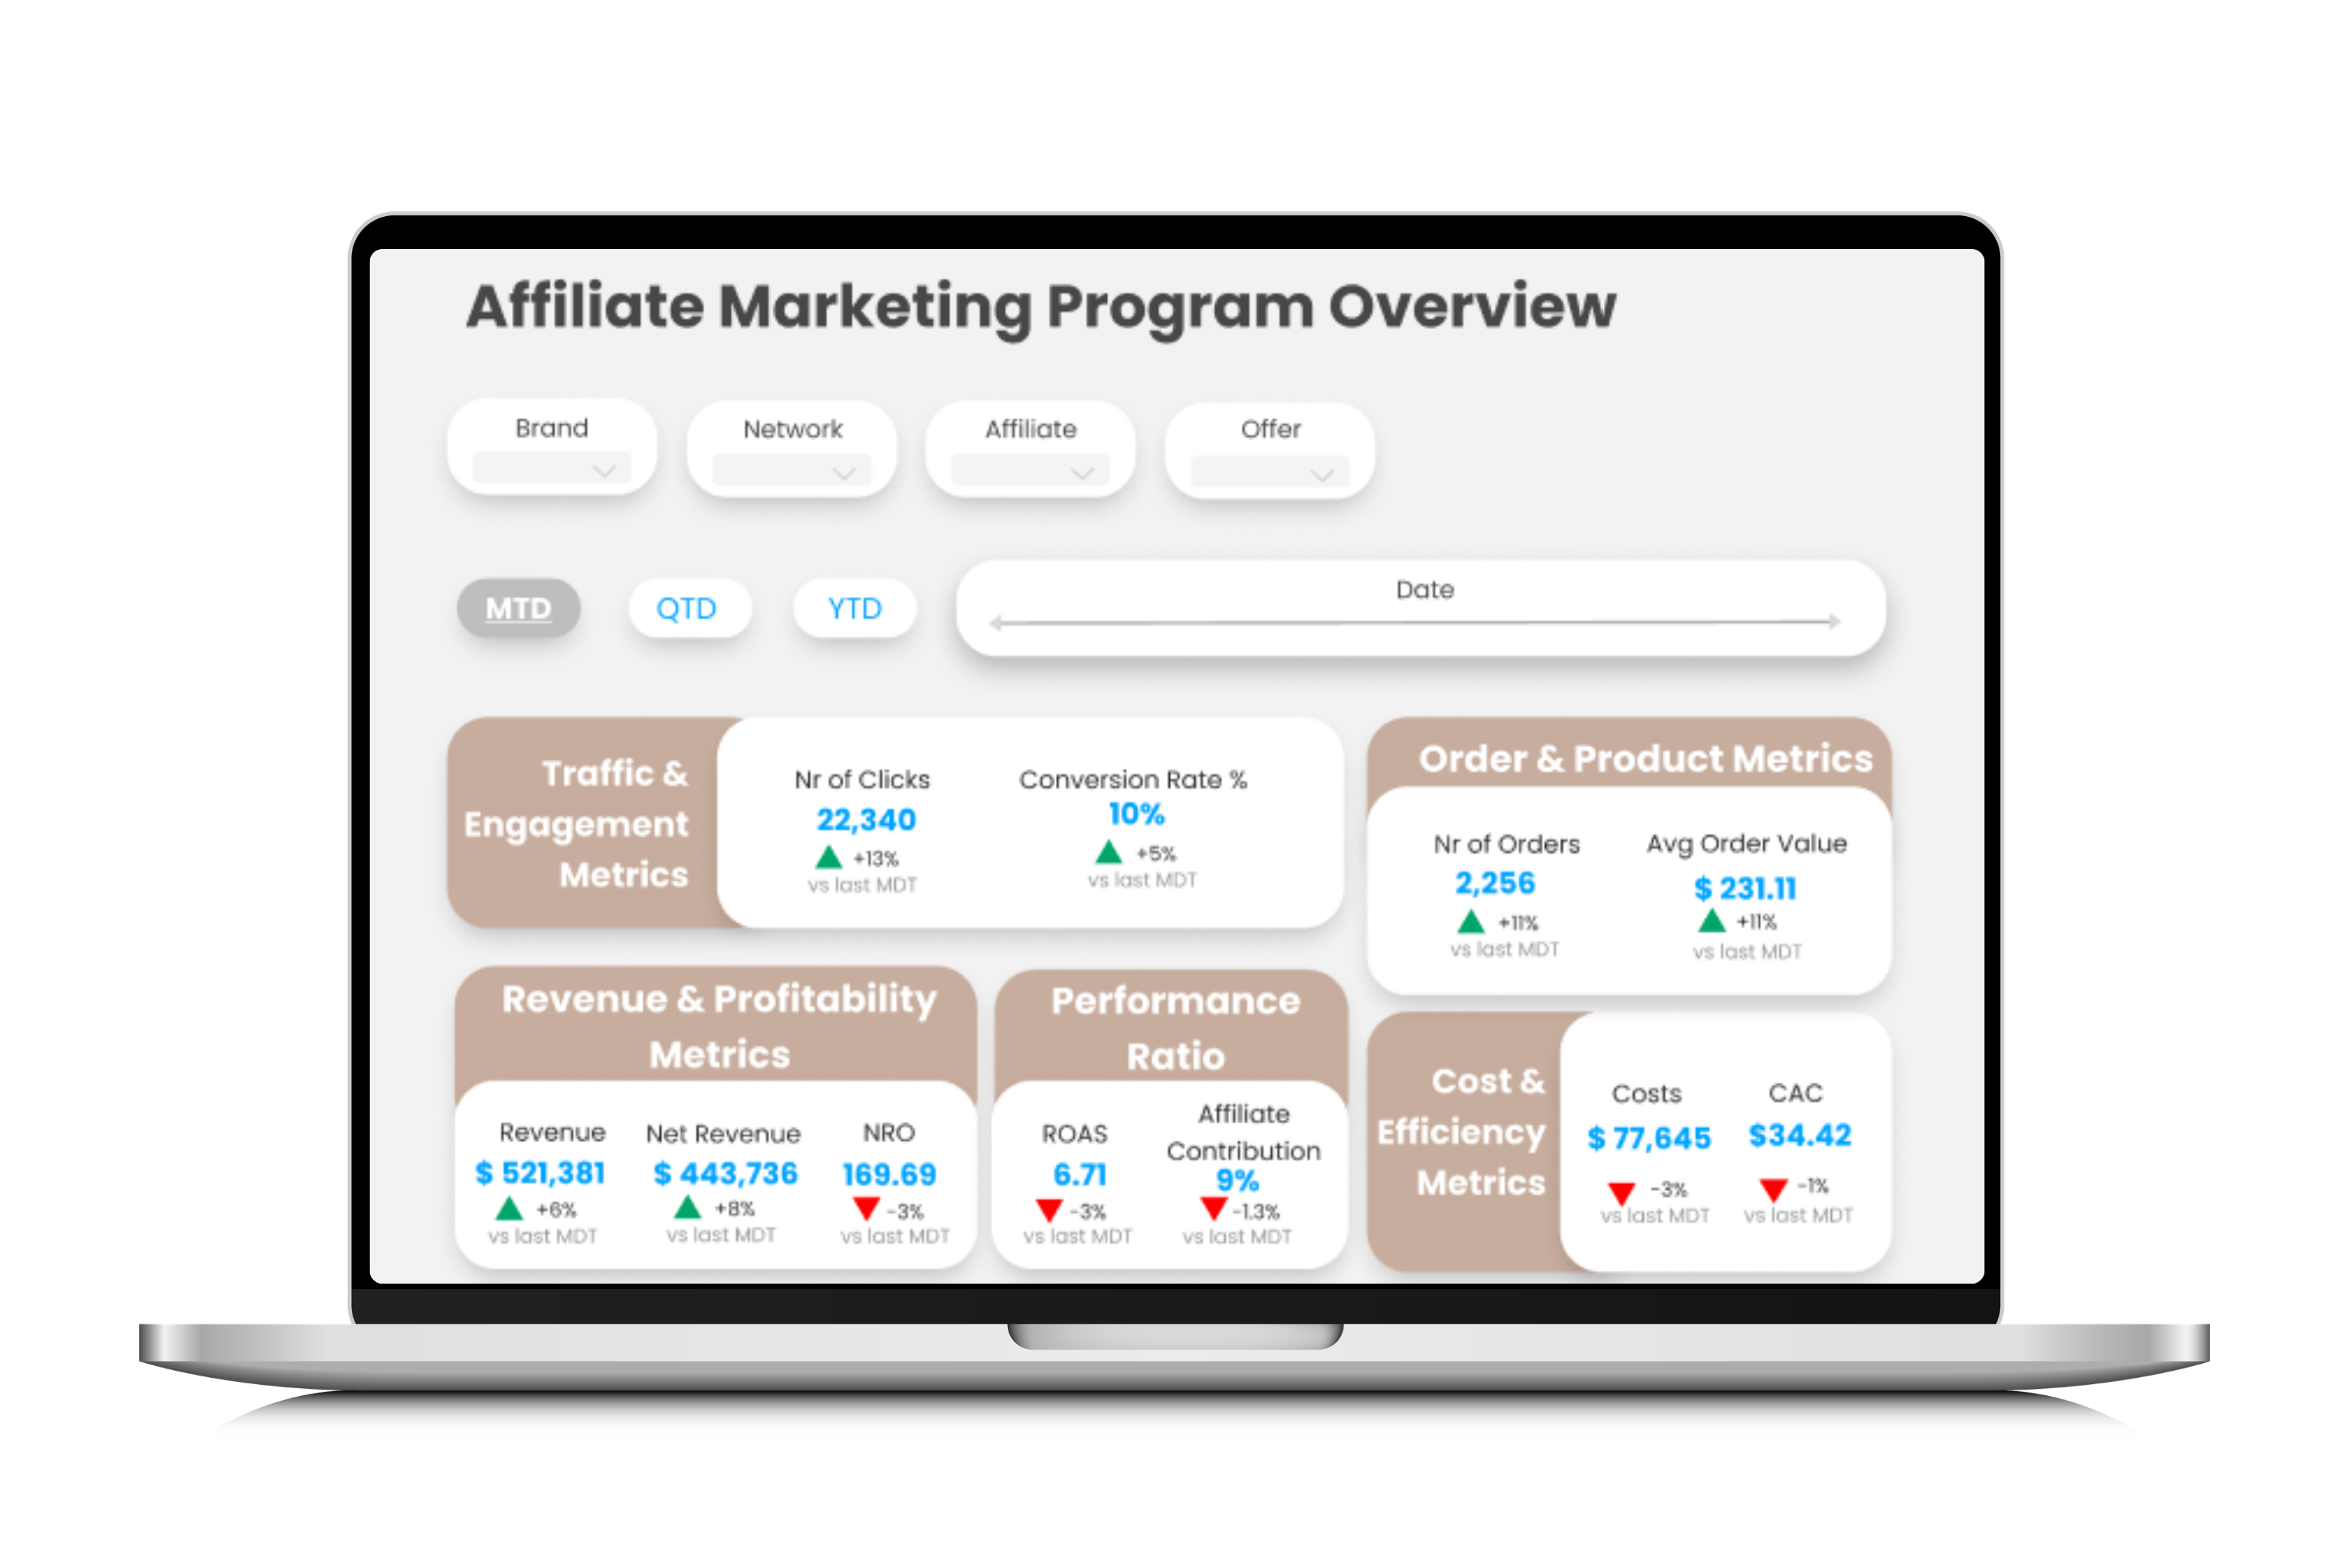
Automated Invoice Calculation from Raw Trip Data
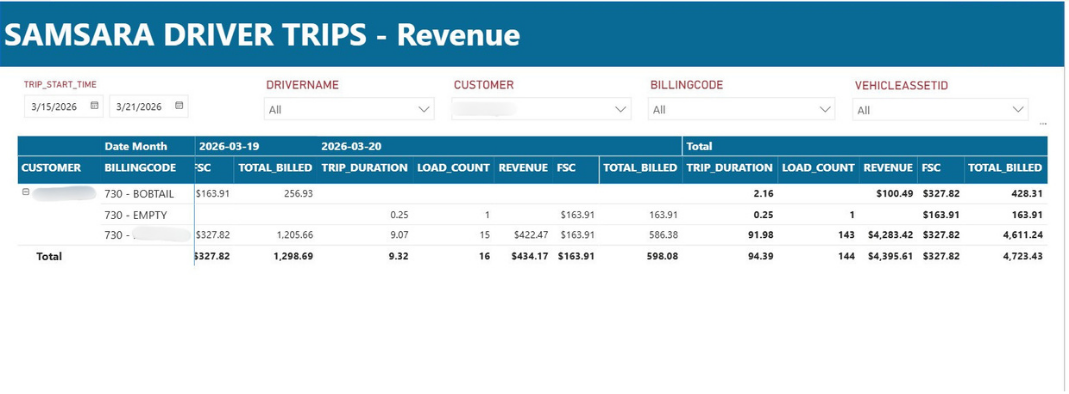
Once trips are completed, the system pulls every driver trip from Samsara and calculates billable amounts automatically. The Samsara Driver Trips report breaks down each customer's billing codes, trip durations, load counts, revenue, and fuel surcharges by date. This is the calculation engine that replaced the old Excel-based process: every kilometer, every hour, and every load is now captured and priced according to customer-specific rate cards.
Driver Logging Quality Control
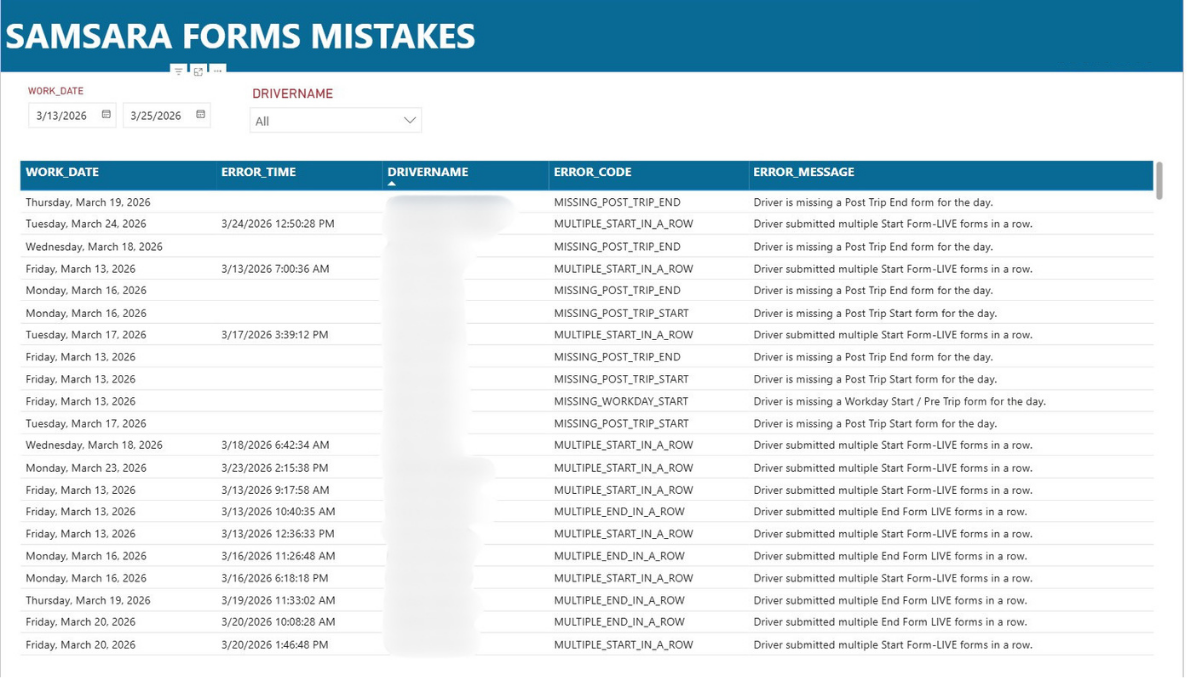
Accurate invoicing depends on accurate driver data entry. The Samsara Forms Mistakes report automatically flags driver logging errors: missing post-trip end forms, duplicate start forms submitted in a row, or missing workday start entries. Operations reviews these exceptions daily, correcting data before it feeds into invoice calculations. This quality control layer prevents billing inaccuracies at the source.
Invoice Review and Approval Console
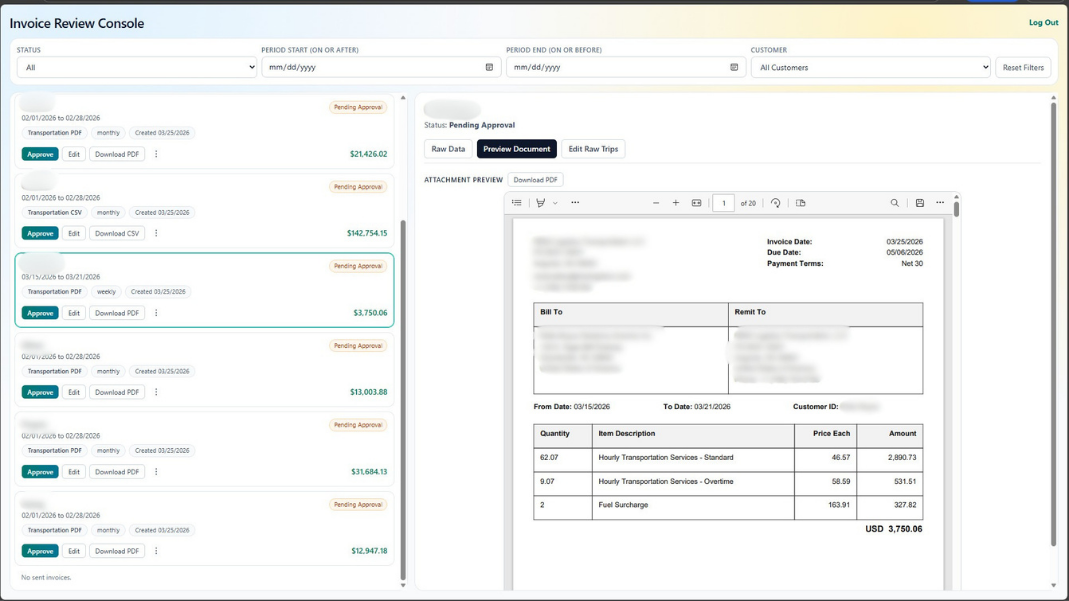
The final step is human review. The Invoice Review Console is a custom web application where finance staff can browse all generated invoices, filter by status, customer, or date range, and preview the formatted PDF before approval. Each invoice shows the calculated line items (standard hourly rates, overtime, fuel surcharges) with approve, edit, and download options. This gives finance full control over what gets sent to the customer while eliminating manual invoice creation entirely.
Historical WMS Migration & Future-Proof Reporting
Synapse to Deposco Transition Without Losing Visibility
The company transitioned warehouse management systems from Synapse to Deposco. Historical data risked being siloed permanently.
We:
- Extracted and standardized legacy Synapse historical data
- Modeled it into a unified schema
- Designed reporting logic to seamlessly join legacy and future Deposco data
- Ensured continuity in Power BI reporting
The result:
Leadership could analyze multi-year warehouse performance despite platform migration. No data loss. No reporting discontinuity.
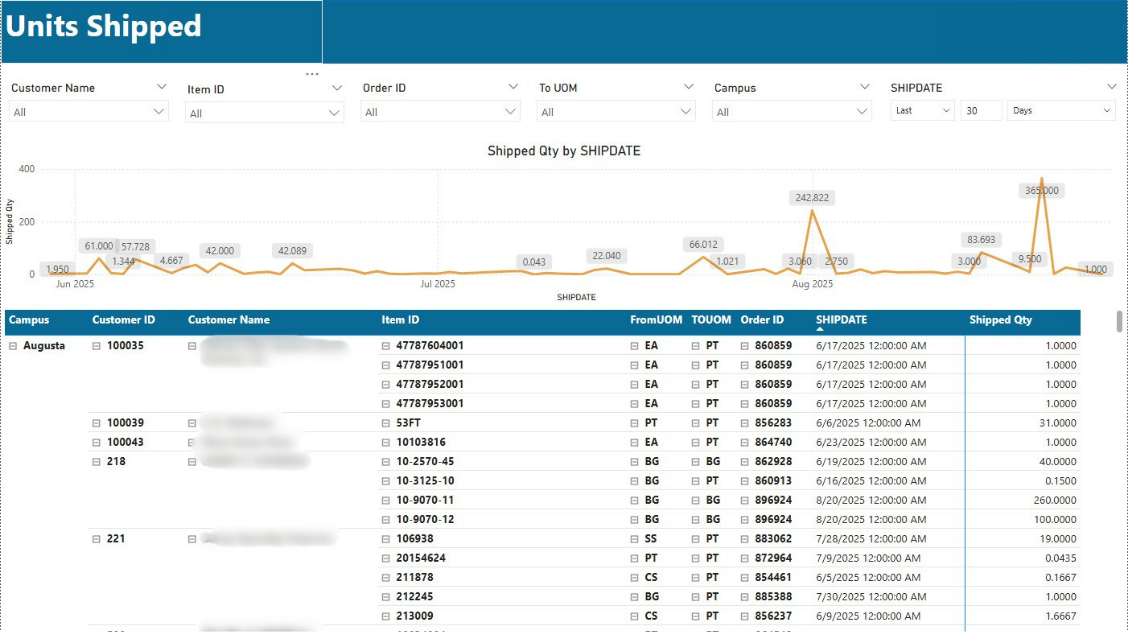
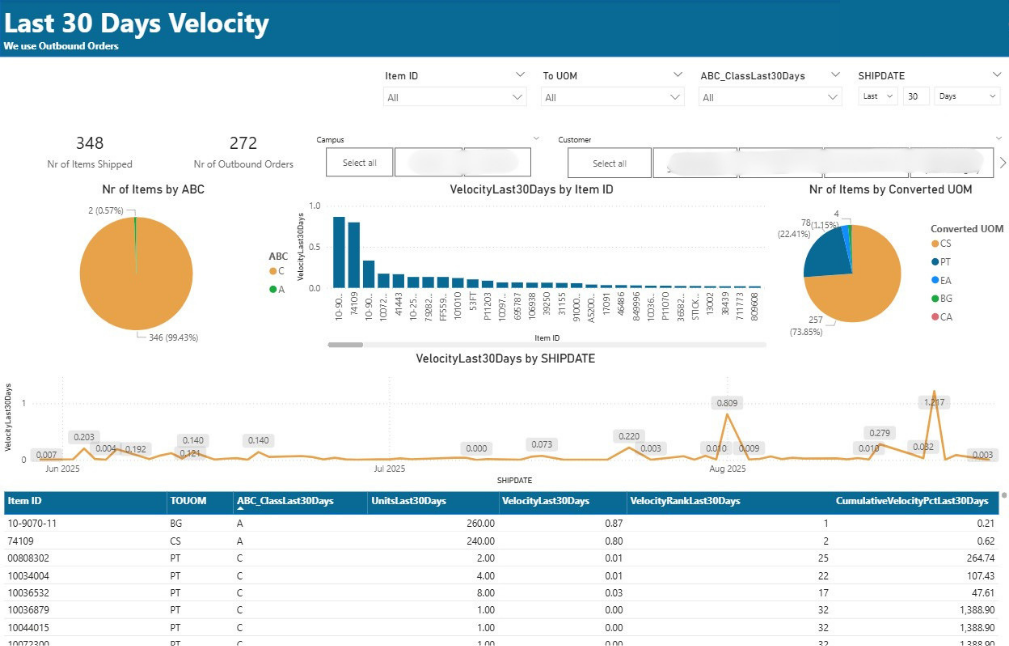
ABC Velocity Analysis & SKU Segmentation
Inventory Intelligence Beyond Storage
Warehouse profitability depends on understanding:
- Fast movers
- Slow movers
- Dead stock
- Storage cost vs turnover
We implemented ABC velocity segmentation:
- Classified SKUs based on movement and revenue contribution
- Identified storage inefficiencies
- Enabled optimized space allocation
- Provided data-driven insights into working capital usage
This moved warehouse reporting from reactive to strategic.
Replacing Fivetran with Python HubSpot to Snowflake Sync
Reducing Dependency & Increasing Control
Sales pipeline visibility was disconnected from operations. The company relied on Fivetran to sync HubSpot data, which:
- Limited transformation control
- Increased recurring costs
- Restricted schema optimization
We designed a custom data pipeline that:
- Extracts HubSpot data directly
- Loads it into Snowflake
- Applies transformation logic tailored to reporting needs
- Integrates seamlessly with Power BI
This enabled:
- Full pipeline-to-revenue visibility
- Lead-to-customer lifecycle analysis
- Operational capacity forecasting
- Reduced reliance on generic connectors and recurring third-party costs
Result
Operational Intelligence Instead of Spreadsheet Guesswork
After implementation:
- Finance gained real-time margin visibility
- Invoice accuracy improved and revenue leakage was reduced
- Warehouse performance became measurable across system migrations
- SKU segmentation improved inventory planning
- Sales and operations data became connected
- Third-party data dependency was reduced
The company moved from fragmented reporting to structured logistics data analytics infrastructure. Instead of reacting to financial surprises at month-end, leadership now monitors operational performance continuously, backed by automated pipelines and real-time dashboards.
Technologies and Tools
Snowflake, Python, Power BI, Workday Adaptive Planning, HubSpot API, Samsara API, Custom ETL Pipelines