Blog

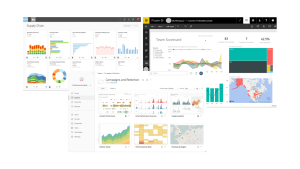
Comparison between Google Analytics dashboard and a BI tool dashboard showcasing general onboarding funnel statistics.
Blog

Business Intelligence & Writeback: Why Web Apps are Best for Writeback

Many startups and product companies try to code their own charts and embed them in their product, while others try to use Power Apps for writeback. However, these solutions are often slower, costlier, and less efficient. In this article, we clarify why using BI tools for reporting and web apps for writeback is the more efficient and cost-effective solution.

Read More »
Comparison of dashboards created by Witanalytica in Looker Studio, former Google Data Studio,
Blog

Looker Studio Alternatives: Why PowerBI and Tableau Lead in Data Visualization

Business Intelligence (BI) tools have become increasingly essential for organizations to make data-driven decisions. While Google Data Studio offers basic visualization capabilities, it falls short when it comes to handling complex data analysis tasks. This article will explore why PowerBI, Tableau, and Domo are the superior choices for organizations looking to handle complex data analysis and visualization.

Read More »

More Articles

Doctor in a modern office reviewing patient health data analytics on a large TV screen.

The Power of Data Analytics in Healthcare

Data analytics in healthcare is driving improved patient outcomes and operational efficiency. Dive into this comprehensive exploration of its key uses, successful case studies, and future potential, and understand how we can overcome challenges to

Read More »
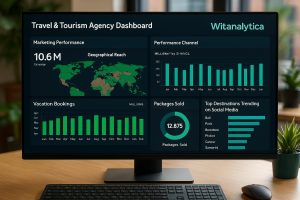
Professional travel data analytics dashboard displaying campaign performance, vacation bookings, and trending destinations.

A Deep Dive into Travel Data Analytics

From personalized customer experiences to enhanced operational efficiency, travel data analytics is revolutionizing the travel and tourism industry. Discover how booking platforms, hotels, car rentals, and cruise ship companies harness the power of data analytics

Read More »

Give us a share